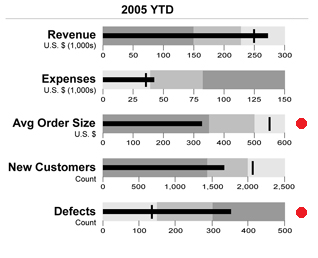
Gauges are like the junk food of dashboards. Just as junk food has little nutritional value but contains too many calories, gauges don’t contain enough data for the space they occupy on a dashboard – little “nutritional” value and too many pixels.
50 Shades of Grey? The book? Not quite – we’re talking about the use of shades in dashboards.
You’ve connected to your data, defined the key performance indicators you want to display, you may have even decided what visuals you want to use to display your data; now it’s time to start designing your dashboard.
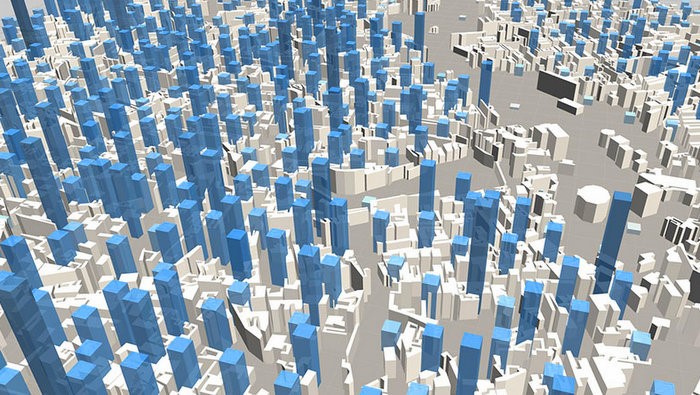
What does SimCity, Civilization, Street Fighter, Twisted Metal, Wii Sports, and Rollercoaster Tycoon all have in common? Well besides being video games, they all feature some form of data visualization.

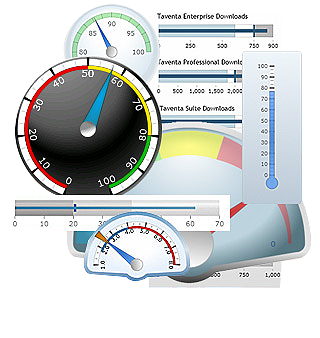 Gauges are like the junk food of dashboards. Just as junk food has little nutritional value but contains too many calories, gauges don’t contain enough data for the space they occupy on a dashboard – little “nutritional” value and too many pixels.