
Visualizing Averages
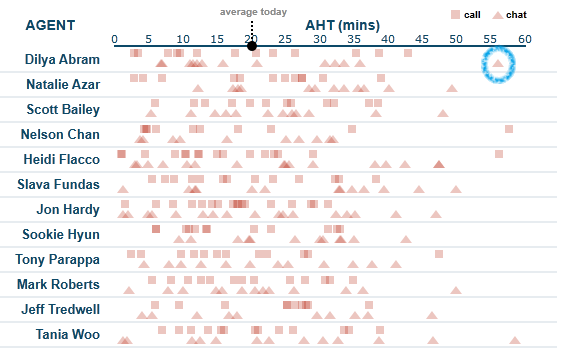 Although averages are very easy to understand, they often do not tell the full story. And when you’re trying to improve your business and create efficiency, knowing the full story is a huge part of that.
Although averages are very easy to understand, they often do not tell the full story. And when you’re trying to improve your business and create efficiency, knowing the full story is a huge part of that.
Although averages are very easy to understand, they often do not tell the full story. And when you’re trying to improve your business and create efficiency, knowing the full story is a huge part of that.

Dundas Dashboard Version 5 have designed it with new customization options that work in parallel to your business rules and make your life easier.
 Businesses are currently told that their data is one of the most important commodities, which means everyone now seems to be hoarding and capturing everything they can, just in case it is needed one day for that all-important report that will make the Executives millions of dollars. As a result, databases are growing at an extraordinary rate.
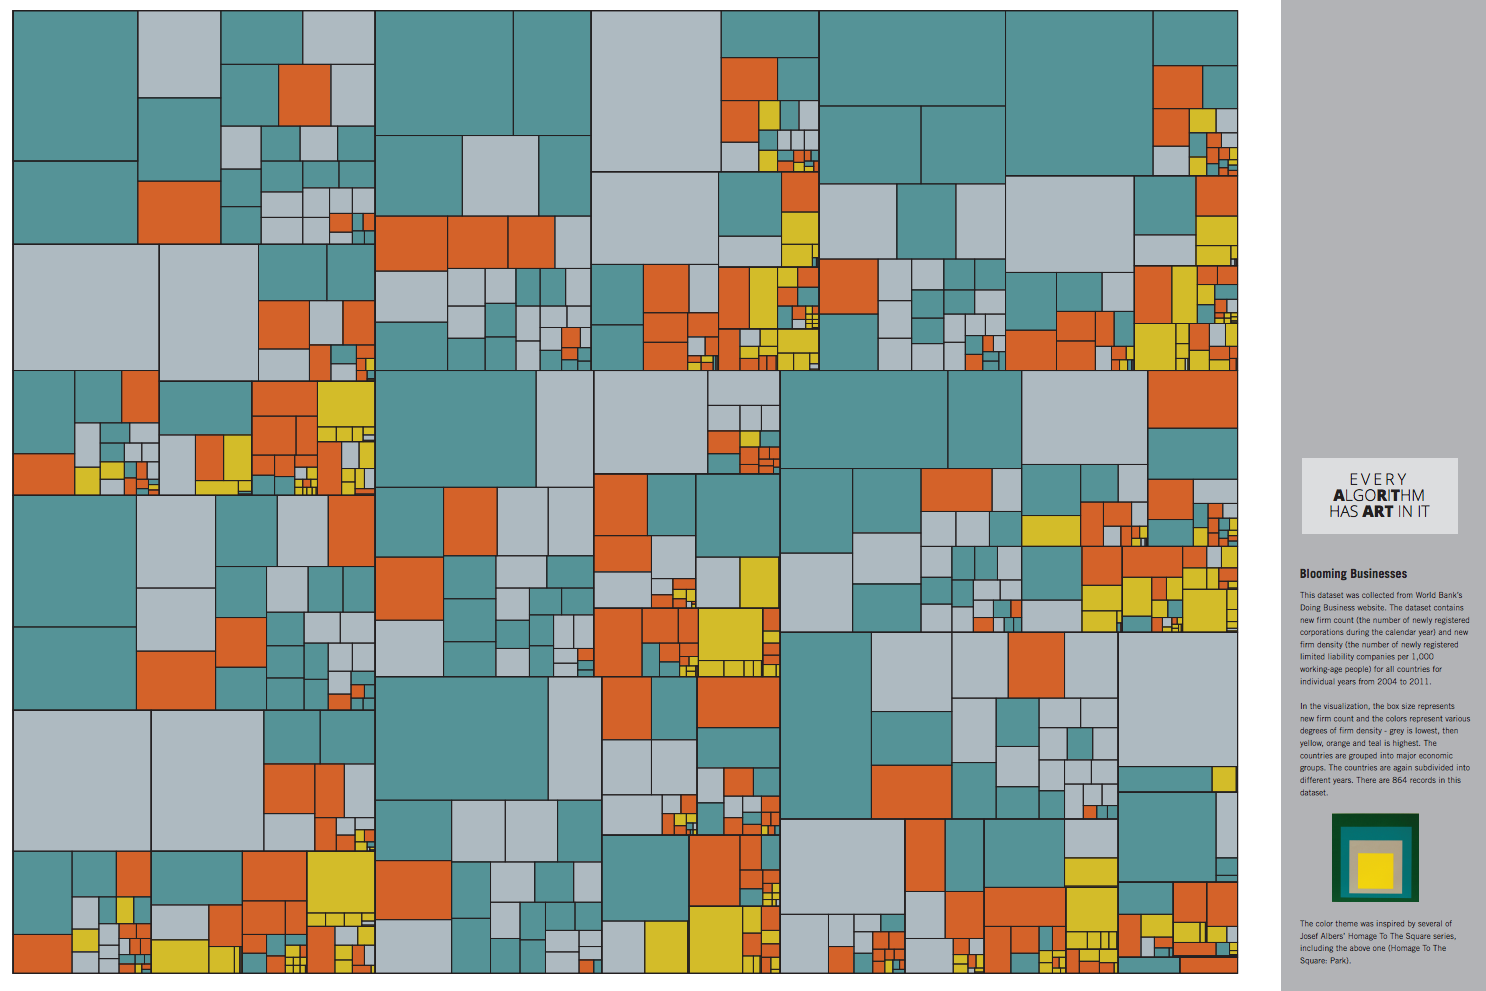 Ben Shneiderman's series of algorithmically generated displays are currently hanged "on the walls in the University of Maryland Computer Science Instructional Center" his tactics and artist talents are explained here

Dundas Data Visualization has taken advantage of HTML5 ever since version 4, but with Dundas Dashboard Version 5 we’ve taken care to fully utilize more of its functionality than ever.
Dundas Data Visualization, Inc.
400-15 Gervais Drive
Toronto, ON, Canada
M3C 1Y8
North America: 1.800.463.1492
International: 1.416.467.5100
