1. Overview
This article shows how you can set up a filter interaction on components such as a buttons and not only on visualizations, which will filter a visualization when clicked.
The following example uses a button, but other non-data components such as labels and images will work the same way.
2. Example dashboard
As an example, we are visualizing OrderQty by Product in a table visualization on a dashboard.
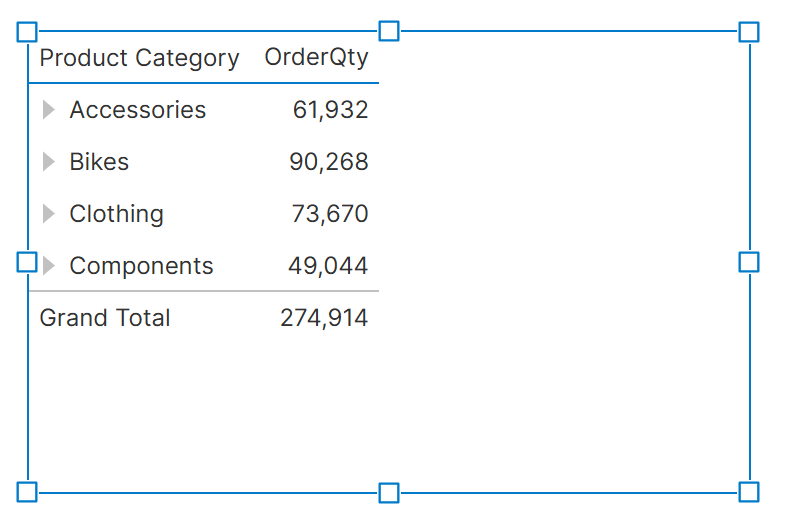
We can add a button to this dashboard that will apply a filter value of our choice to this visualization.
3. Add a button component and set up filter interaction
Click Components in the toolbar and then Button in this example.
In the toolbar or right-click menu for the button, click Set Up Interactions, and then Filter.
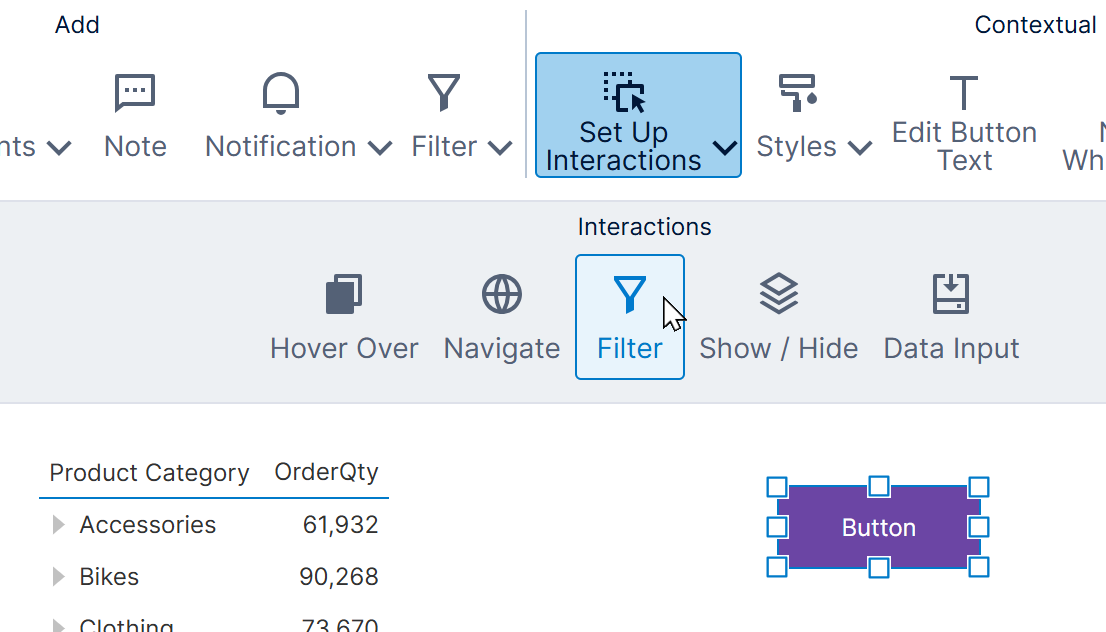
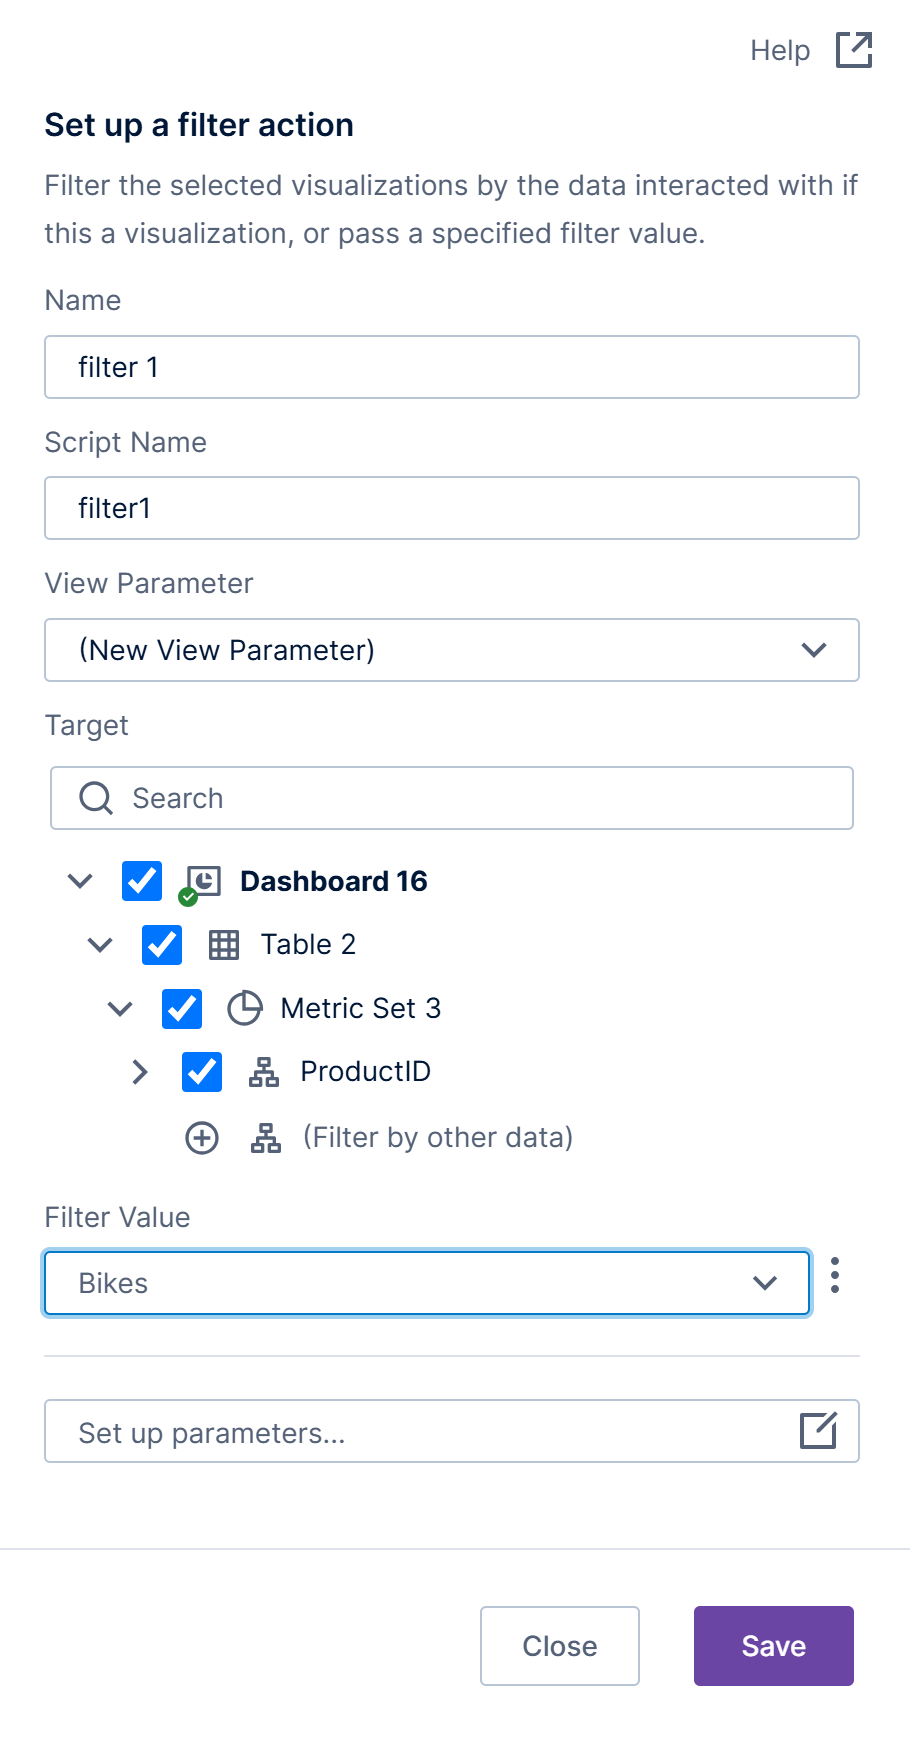
In the filter interaction dialog, optionally set a descriptive Name if you plan to set up multiple interactions, then choose what data to filter:
- In version 26.3 and higher, you can leave View Parameter set as (New View Parameter) to allow one to be generated for you automatically; otherwise, set this to a view parameter you've set up ahead of time.
- Under Target, you can choose which visualization data to filter by in version 26.3 and higher (e.g., Product), similar to connecting a filter. You can click (Filter by other data) to filter by some data not already added to a visualization's Data Analysis Panel.
- Once your view parameter is selected and connected to your target visualizations, you can set the Filter Value to apply when the interaction is triggered (e.g., when the button is clicked).
4. View the dashboard
Switch to View mode in the toolbar to test the dashboard.
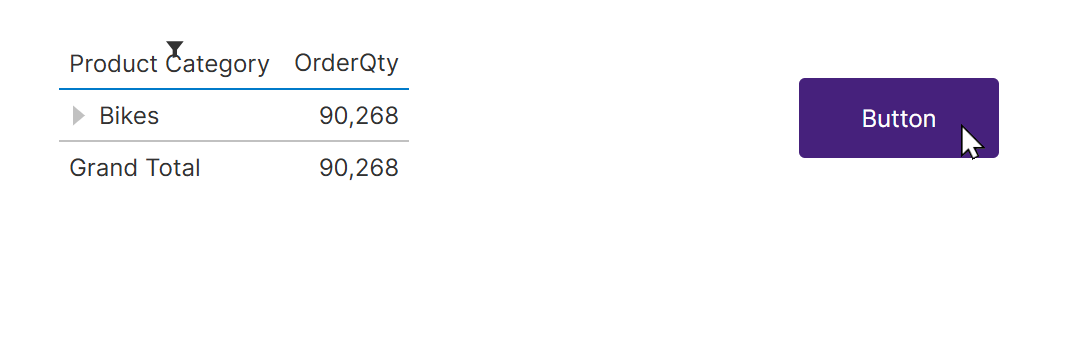
Click the button to see the table visualization filtered to the value you selected during setup.
5. Add a view parameter
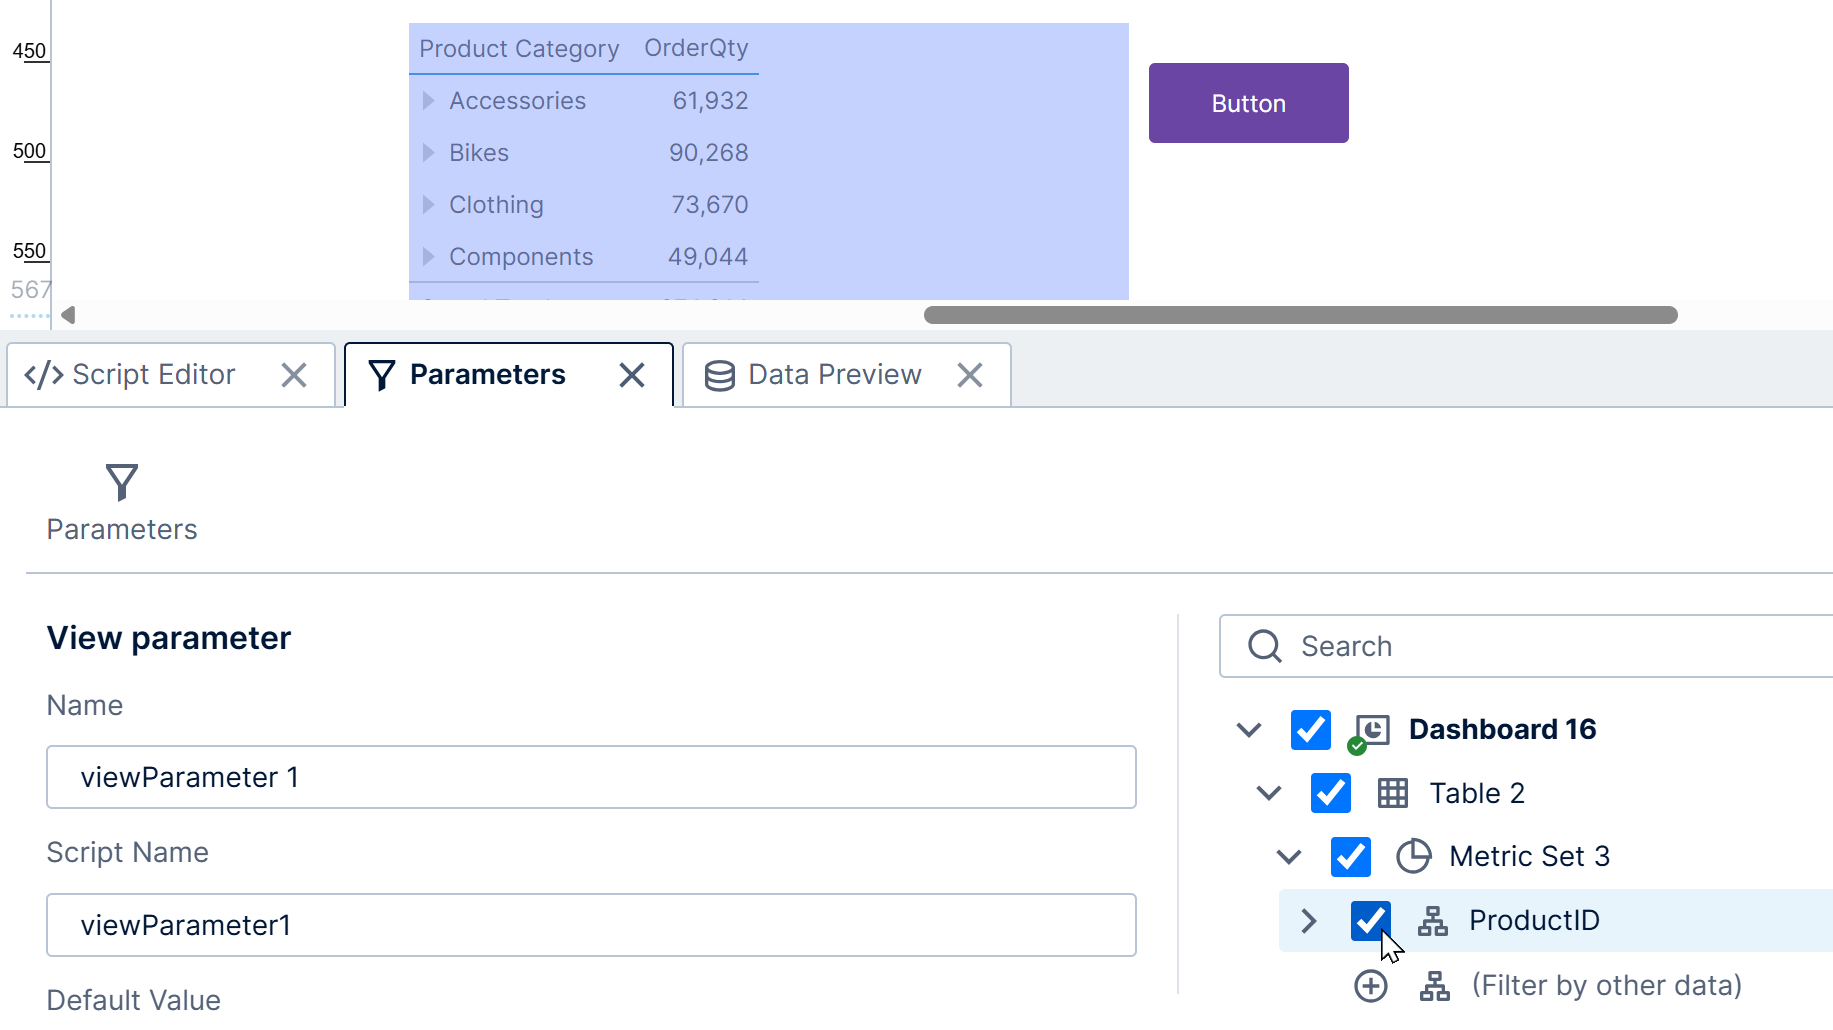
Before version 26.3, you should create your own view parameter ahead of time before setting up the filter interaction, with the steps below as an example. You can also optionally do this in newer versions. Alternatively, you could reuse another view parameter already created for another interaction or a filter and connected to the visualization data that you want filtered.
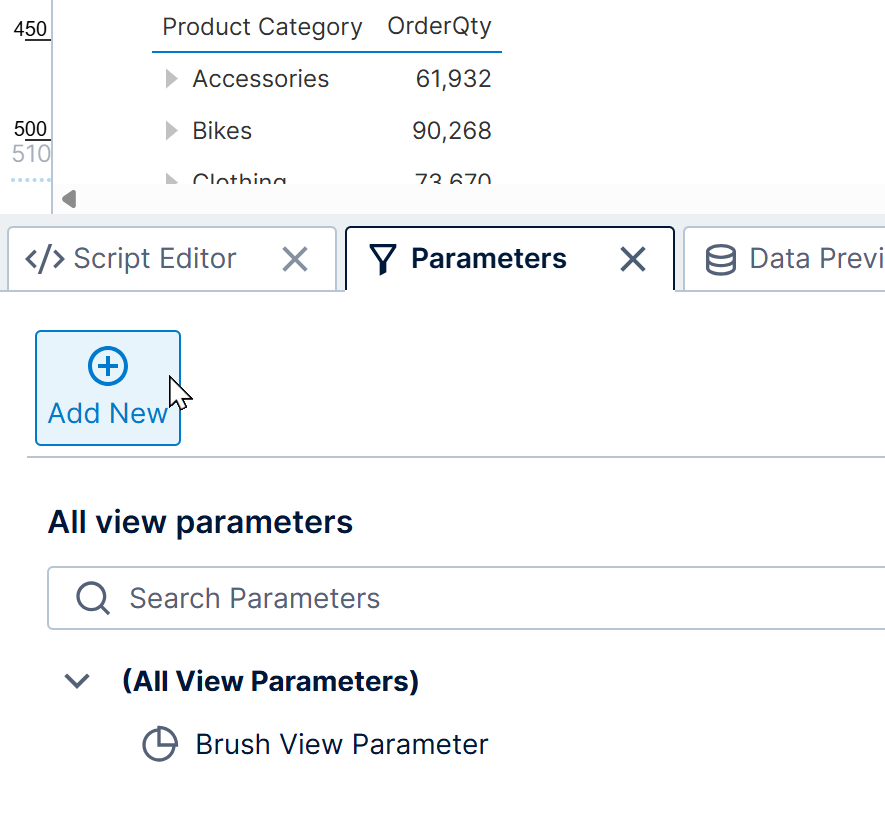
Click to open the Parameters window, docked to the bottom of the screen by default. If you already have a view parameter connected to some data, you can click to expand it to see what it's connected to. (The Brush View Parameter is used for data brushing.)
To add a new view parameter, click Add New in the Parameters window toolbar.
For our example, we will connect the new view parameter to the Product hierarchy in our table visualization.