Python Data Generator
The Python Data Generator transform lets you generate data by writing scripts using the Python programming language. This is similar to the Python Analysis transform except that it does not accept input from a preceding transform and generates its own output directly from Python.
You can use the Python Data Generator transform to provide data to be used or visualized in Dundas BI. For example, Python can connect to and manipulate REST API data into a usable format, or generate data for prototyping or developing proof-of-concept dashboards.
To learn more about the Python language, see python.org.
1. Setup
The Python programming environment must be installed on the Dundas BI server for you to use the Python Data Generator transform.
This is normally installed for you automatically as a prerequisite. See Install Python for more details, and for examples of how to install additional Python packages to use in your transforms.
2. Input
The Python Data Generator transform does not have any inputs. It generates output by running Python scripts.
3. Add the transform
When creating a new data cube, you can add the Python Data Generator transform to an empty canvas from the toolbar.

You can also create a new data cube from Dundas BI's main menu, and choose Python Data Generator in the dialog of options that appears.
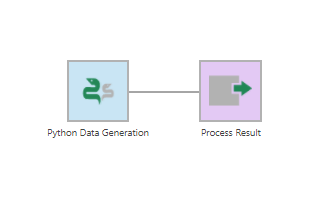
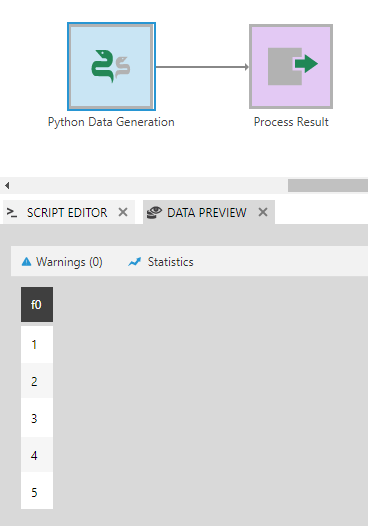
The Python Data Generation transform is added to the data cube and connected to a Process Result transform automatically.
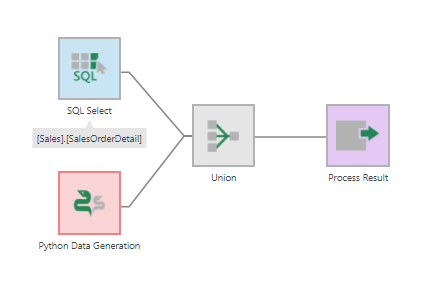
You can also add the Python Data Generator transform from the toolbar to an existing data cube process, and use a Union transform or another transform that combines data from multiple inputs.
4. Configure the transform
Double-click the Python Data Generation transform, or select Configure from its right-click menu or the toolbar.
In the configuration dialog for the transform, the key task is to enter a Python Script that returns a result. Optionally click Edit script to use the Script Editor window for more space and to access other helpful features.
As a simple example, a script for generating a column of numbers from 1 to 5 looks like this:
return (1,2,3,4,5)
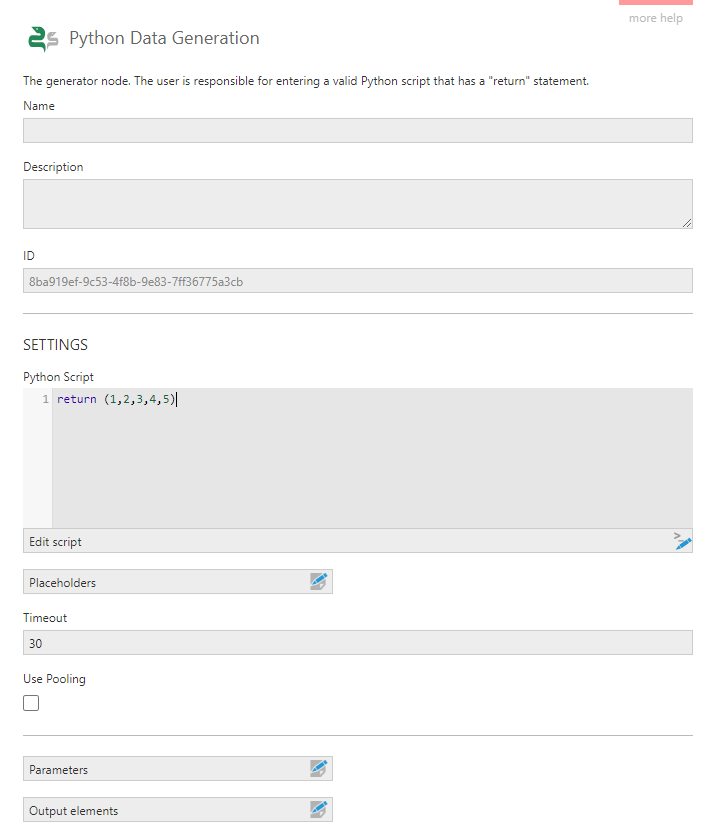
In this dialog, you can set up Placeholders to insert into the script that pass in parameter values similar to when using a manual select. Insert the Identifier you entered for the placeholder (beginning and ending with the $ symbol) into your script to access the current parameter value. When typing into the Python Script box shown in the image above, you can type the $ symbol or right-click for a popup list of the current placeholders, then use the keyboard or mouse to select and insert it.
Select the Use Pooling option to reuse Python processes between execution of Python scripts to improve performance compared to starting a new process each time. There are corresponding configuration settings for Dundas BI administrators in the Python Pool category to manage the number of processes and their memory consumption.
5. Output
The output of the Python Data Generator depends on the script it is configured with. It can be a single value, a column of values, or multiple columns.
In the case of the simple script for generating numbers from 1 to 5, you can see an output column named f0 in the Data Preview window.
6. Generate data from Twitter
An example Python script for generating data is using Twitter REST API to connect to your Twitter account. This essentially uses a Python Data Generator transform in a data cube as a Twitter data connector.
6.1. Setup
This particular example relies on the tweepy package in Python, which may first need to be installed by an administrator with access to the Dundas BI server. For a Windows server, for example, open a command prompt running as administrator, and enter the command pip install tweepy.
You can set up a new Twitter developer application on their developer site. After your application is created, you will need to create an access token and get the following information from the Keys and Access Tokens tab:
- Consumer Key (API Key)
- Consumer Secret (API Secret)
- Access Token
- Access Token Secret
6.2. Create the script
To generate the Twitter data, configure the Python Data Generation transform and add the following script:
import tweepy

auth = tweepy.OAuthHandler("key", "secret")
auth.set_access_token("token", "secret")
client = tweepy.API(auth)

friends = client.friends()

myList = []
count = 0
for m in friends:
            myList.append([])
            myList[count].append(m.screen_name)
            myList[count].append(m.name)
            myList[count].append(m.created_at)
            myList[count].append(m.friends_count)
            myList[count].append(m.listed_count)
            myList[count].append(m.followers_count)
            myList[count].append(m.favourites_count)
            count = count + 1
return list(zip(*myList))
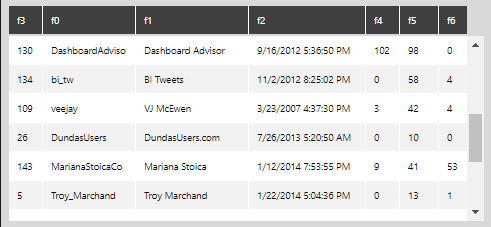
This will create a table with seven columns based on your friend data on Twitter.
6.3. Adjust the column names
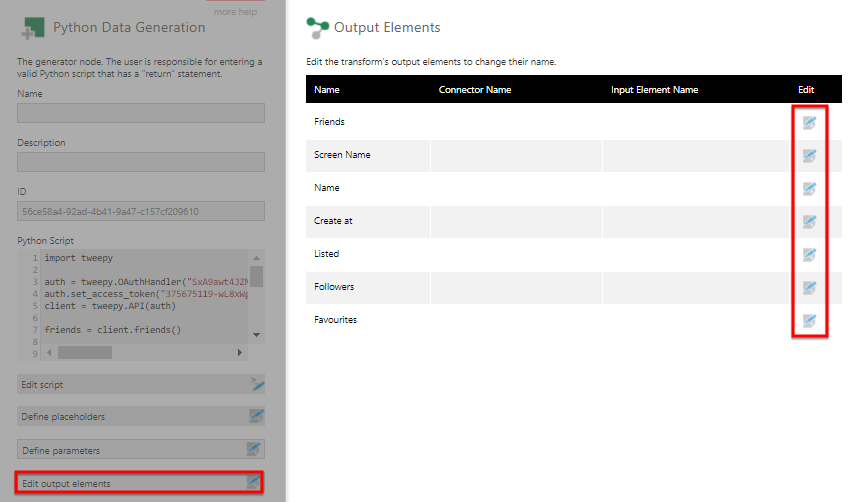
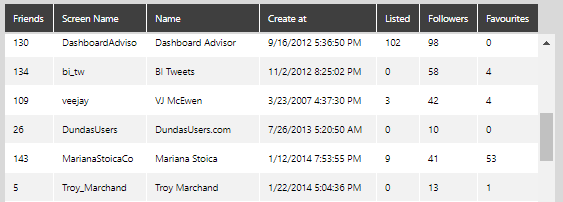
Configure the transform again and click Edit output elements.
Edit each output elements and provide a relevant column name.
Result:
7. Generate data from a JSON file
Another example Python script for generating data is by connecting to a JSON file. This essentially uses a Python Data Generator transform in a data cube as a JSON data connector.
7.1. Setup
This example relies on four packages to be installed in Python on the Dundas BI server. If needed, open a command prompt as an administrator if the server runs Windows, for example, and use commands like the following for the four packages:
- pip install numpy
- pip install pandas
- pip install jsonlib-python3
- pip install requests
7.2. Create the script
To generate the JSON data, configure the Python Data Generator transform and use script like the following, which uses json_normalize:
import json, requests
from pandas.io.json import json_normalize
url = "http://example.domain.com/data.json"
resp = requests.get(url)
data = json.loads(resp.text)
return json_normalize(data)
This can create a table reflecting all of the data in the referenced JSON file.
8. Generate data from a REST call
This example relies on the same four packages in Python as the previous section. An administrator with access to the Dundas BI server may need to install these packages as described above.
This example will log onto Dundas BI using REST in order to get a session ID. Next, it calls the Dundas BI file system query API with that session ID to retrieve all the dashboards that exist in a specific project. Finally it logs off, and then returns the results.
8.1. Create the script
import json, requests
from pandas.io.json import json_normalize

host = "<<Insert host address>>"
username = "<<Insert user name>>"
password = "<<Insert password>>"
projectId = "<<Insert project id>>"

# authenticate with DBI
response = requests.post(host + "/api/logon/", json={"accountName":username, "password":password})
sessionId = response.json()["sessionId"]

requestBody = {
  "queryFileSystemEntriesOptions":{
      "entryIds":[
         projectId
      ],
      "pageNumber":0,
      "pageSize":0,
      "queryOptions":"RecursiveQuery",
      "orderBy":[
         {
            "fileSystemQueryField":"CreatedTime",
            "sortDirection":"Descending"
         }
      ],
      "filter":[
         {
            "field":"ObjectType",
            "operator":"Equals",
            "value":"Dashboard",
            "options":"None"
         }
      ]
   }
}

# query the file system api
response = requests.post(host + "/api/file/query", json=requestBody, headers={"Authorization":"Bearer " + sessionId})

# logoff
requests.delete(host + "/api/session/current", headers={"Authorization":"Bearer " + sessionId})
result = json.loads(response.text)

# return the result
return json_normalize(result)
9. See also
- Install Python
- Transform: Python Analysis
- Transform: R Data Generator
- Transform: Flatten JSON
- Connecting to Generic Web data sources
- List of transforms
- Using manual select placeholders
- Creating a data provider
- Off the Charts: Adding Weather Data to Dundas BI is a Breeze
- Off the Charts: Advanced Sentiment Analysis in Dundas BI

