1. Overview
There are built-in data input features for storing data entered by end users into the warehouse data storage area, as well as notes functionality to allow users to add and reply to notes tagged to data points.
In some scenarios, there may be a specific requirement to store input data outside of the application instead. The following article outlines an example of how you can write data to your own database.
2. Write back sample
Users can provide more context or communicate with other users viewing the same data cube data by adding notes or annotations to a data point.
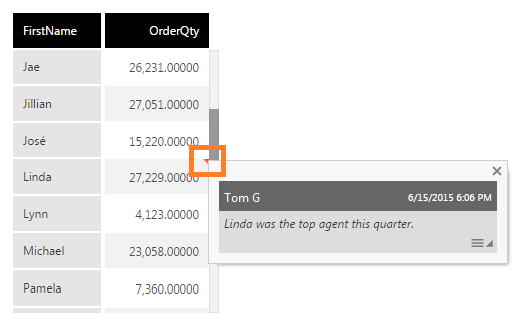
Instead of viewing notes by hovering over the red triangle like in the image above, we will allow users to view or add live comments in another column of the table visualization and store them in our own database.
Here is an overview of how to write back data from a dashboard:
- Define a stored procedure or write a manual query that will capture and write back to the data to a database (and also return some data).
- Create a data cube using that stored procedure or manual query that will capture and write back the data to a database using public parameters passed from the dashboard.
- Design a dashboard that will provide the user option to input the information to write back using different components or filters, such as a drop down list or textbox.
- Connect view parameters and/or filters to the data cube parameters to pass them the captured information for executing the procedure or query and writing back to the database.
3. Set up the data
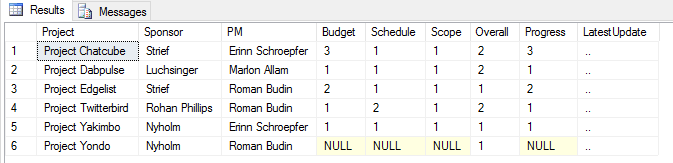
The sample setup below uses SQL Server as the data source.
In this case, a new column in the SQL database table is used to store the comments entered by users. A placeholder value for the comments such as '..' allows it to be intentionally shown as empty for this example.
3.1. Create the stored procedure
Create a stored procedure that receives two parameters: the comment column (LatestUpdate) and a unique ID such as the Project name in the sample data, which identifies one specific row to be updated in the database.
This example also returns the updated data from the table to be displayed using the same stored procedure.
CREATE PROCEDURE [dbo].[Notes]
	-- Add the parameters for the stored procedure here
	@project nvarchar(50),
	@comment nvarchar(MAX)
AS
BEGIN
	-- SET NOCOUNT ON added to prevent extra result sets from
	-- interfering with SELECT statements.
	SET NOCOUNT ON;

	UPDATE [dbo].[Table_1]
	SET LatestUpdate = @comment
	WHERE Project = @project
	SELECT * from [dbo].[Table_1]

END
3.2. Create a data cube
Create a new data connector with the database table modified above.
Create a new data cube using the stored procedure or query.
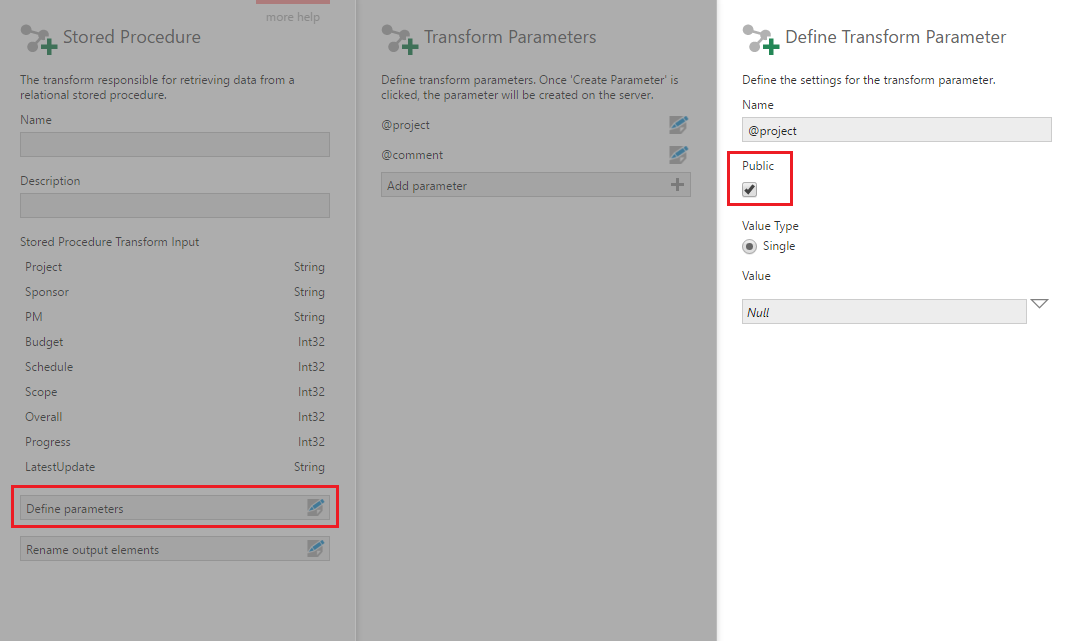
Configure the Stored Procedure transform, or the manual query's placeholder parameters, and expose the parameters as Public so they can be used outside of the data cube.
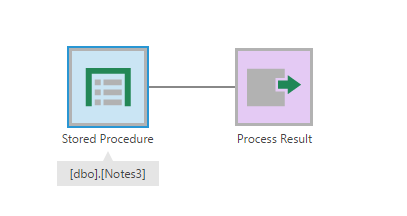
4. Design the dashboard
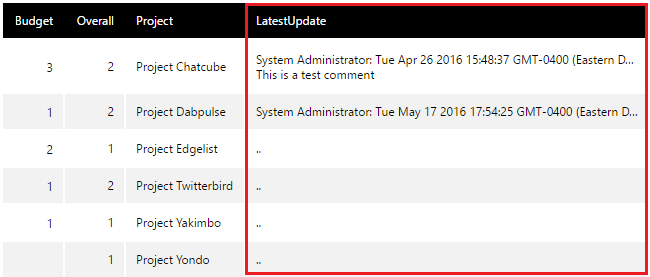
Drag and drop the data cube on the dashboard canvas. The data appears as a table visualization.
In our example, which returns all of the updated table data from the same stored procedure, continue adding the rest of the data to be displayed as columns in the table.
To prevent old data from being returned if the same parameter values are passed later but are meant to execute the procedure/query each time, you can bypass the data cache on this metric set.
4.1. Add a drop down list
This example uses a drop down list to pass parameter values, although you can use other controls instead.
- From Components in the toolbar, select Drop Down List.
- With the drop down list selected, open the Properties window.
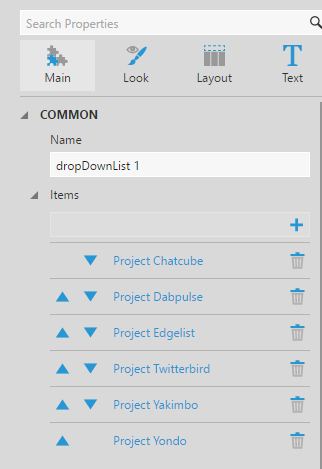
- You'll see that the drop down list is configured with a single option item by default. Click the item to modify it.
- Under Animation & Interaction (previously in the Main tab), set the Value to the name of the Project as it is in the database. Set the Caption property to the same for this example, to display the same name.
- Add new items and repeat the previous step for other values.
4.2. Add a textbox
With nothing selected on the canvas, go the toolbar, and from Filters select Textbox.
If the filter was automatically connected, disconnect it and open the Properties window to change its settings:
- Select the Manual Items property option, under Filter Values in recent versions.
- Select Hide Token Menu under Tokens & Menus (previously in the Look tab).
- In the Design tab under Font & Text (previously in the Layout tab), select Multi-Line.
- Clear the Label Text and Tooltip Text.
(If the textbox displays a value from when it was connected to data, it will instead display the value from its Value property the next time the dashboard is opened.)
4.3. Add view parameters
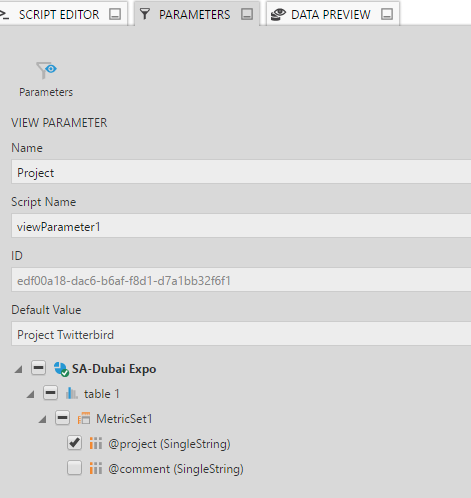
Open the Parameters window, click Add New to add a new view parameter, and rename it to something meaningful such as Project.
Select the @project parameter defined in the stored procedure to pass a value to it.
Click the Parameters button to return to the list of All View Parameters.
Add another view parameter and assign it to the @comment parameter defined in the stored procedure.
5. Add the script
This example will use a button with script to pass the values to the parameters, but it's also possible to connect filters to data cube parameters and use an update button.
In the toolbar, click Components and choose Button.
Add a script action to the Click event of the button, and enter script like the following into the script editor. Update it to refer to the Script Name you chose for each of your view parameters, etc.
var view = this.parentView.control;
var vpProject = view.getViewParameterByName("project");

vpProject.parameterValue.clearTokens();
vpProject.parameterValue.clearValues();

// Populate the @project parameter from the drop down list.
vpProject.parameterValue.value = dropDownList1.value;
vpProject.invalidateParameterValueLastModifiedTime();

var vpComment = view.getViewParameterByName("comment");

// Access the current logged in user name - optional.
var currentLogin = dundas.context.currentSession.accountDisplayName;

vpComment.parameterValue.clearTokens();
vpComment.parameterValue.clearValues();

// Populate the @comment parameter from the textbox.
vpComment.parameterValue.value = currentLogin + ": " + parameterTextBox1.control.value;
vpComment.invalidateParameterValueLastModifiedTime();

//refresh the table control to view the comments in the table.
table1.loadData();
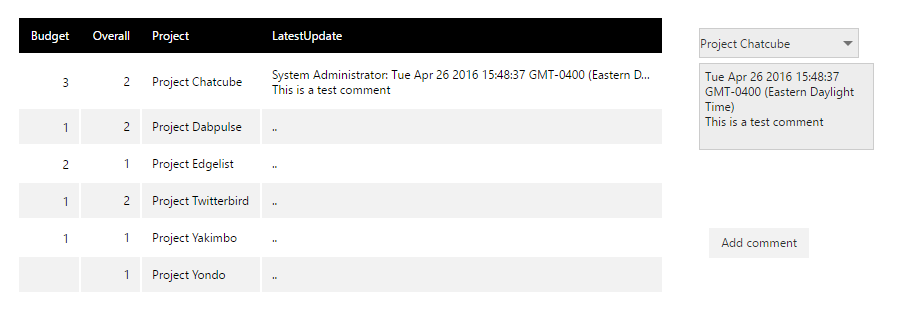
6. Test the dashboard
Click Sandbox View in the toolbar, and choose a project from the drop down list.
Add a comment in the textbox and click on the button. The comment is added to the table: