
1. Overview
This article explains how to group multiple values into one when working with a metric set. This can be done while doing analysis and optionally undone, or to help when data is not grouped the way it's needed.
This option is available when working with a metric set that is checked out to you.
2. Ad hoc member grouping
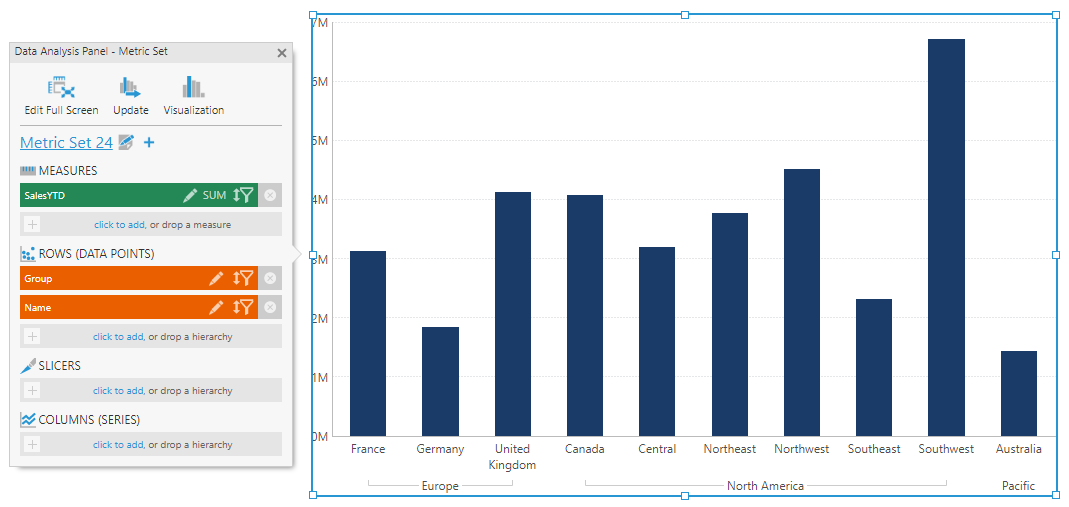
While working with a checked-out metric set in the full-screen editor, or in a dashboard or another view, select data so that at least one element is placed under Rows or Columns in the Data Analysis Panel.
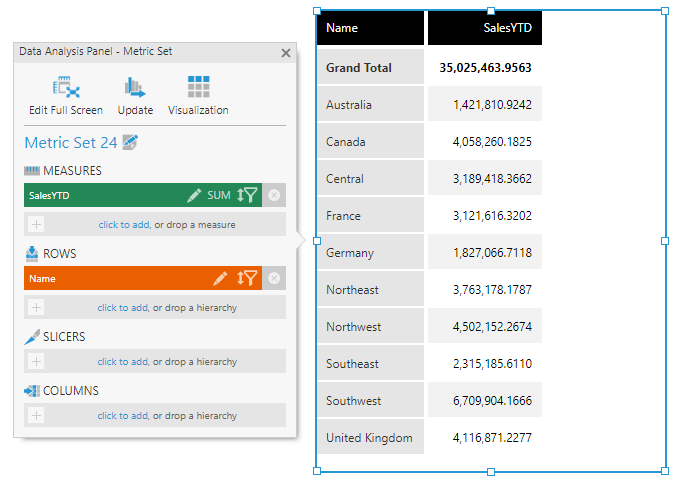
In our example above, the territories representing the United States are separated into members Central, Northeast, Northwest, Southeast, and Southwest.
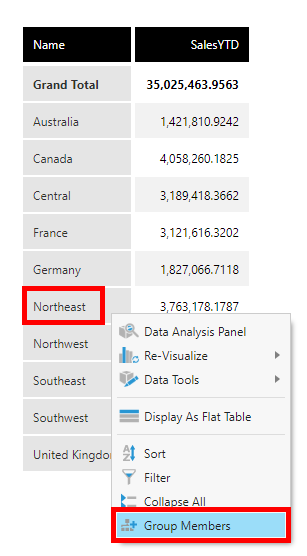
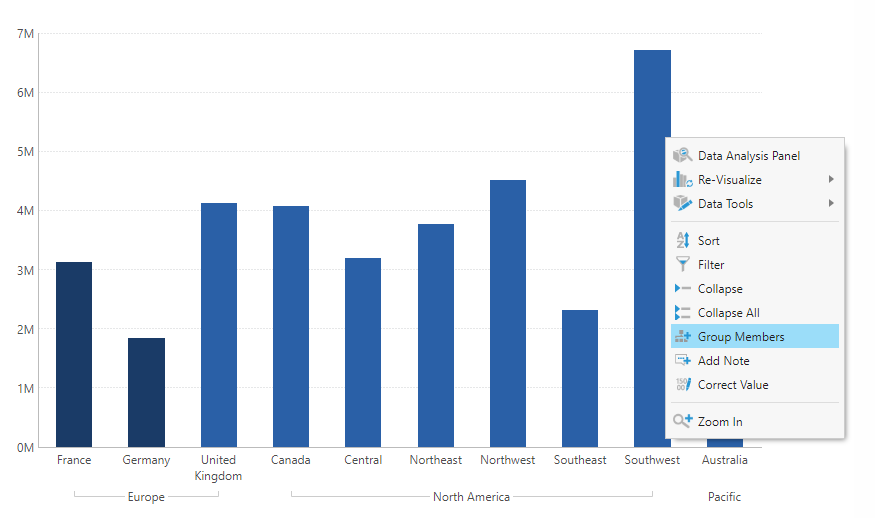
Right-click one of the members and select Group Members. (If you are editing a dashboard or another view, click View in the toolbar first before interacting with a visualization's data.)
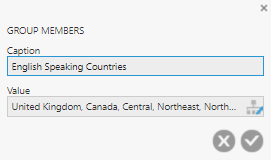
In the Group Members popup, provide a Caption for the group and use the Value drop-down to select the members that should be grouped together if you didn't select them earlier.
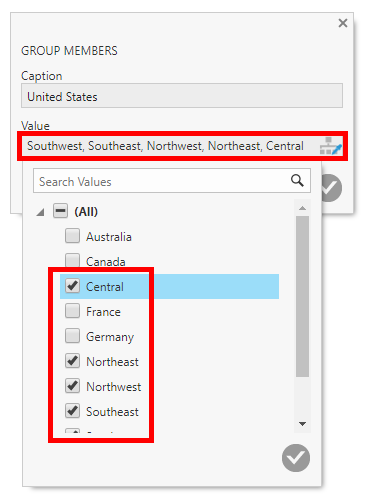
Submit the drop-down and the Group Members popup.
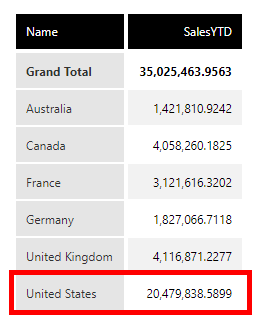
Your group will now be displayed as a single member with measure values aggregated together according to the measure's aggregator (e.g., sum).
To undo this grouping, right-click the group and select the Ungroup option to ungroup it.
A group can't be changed after it's created, but you can ungroup the members and then group them again.
2.1. Working with multiple hierarchies
When your data is grouped by multiple hierarchies, a group you created might be split up by the members of another hierarchy.
In our example from above, we have added the Group hierarchy to the metric set and placed it first under Rows, then we re-visualized into a bar chart.
Right-click on one or more data points and choose Group Members to create a group. (Because there are multiple hierarchies, you may be asked which one you want to group values for.)
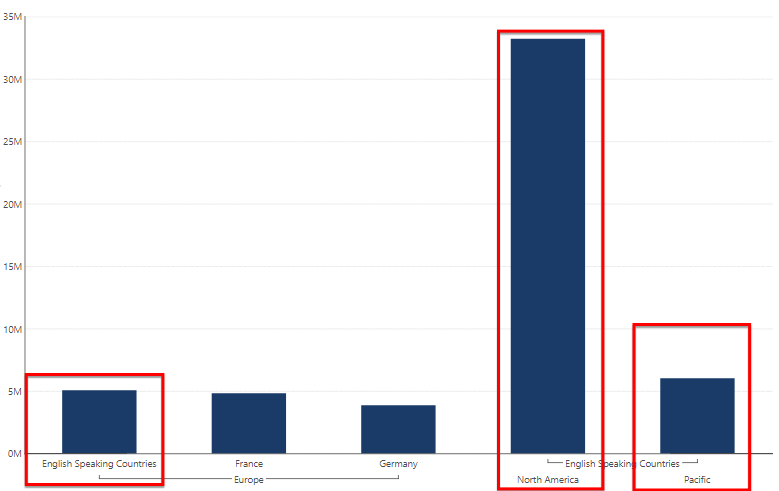
In our example, we will select the English-speaking data points in the chart by clicking and dragging across it to select points, and hold the Ctrl key on the keyboard while selecting additional points.
In the Group Members popup, provide a Caption for the new group, confirm the Value members and submit.
The English Speaking Countries group is now displayed in each of the Group hierarchy elements where it has members, and aggregated accordingly.
3. Notes
- Custom member grouping is not available for the following types of hierarchies:
- Dynamic
- Time-based
- OLAP
- When working with user-defined hierarchies, grouping can be done only within the same hierarchy level and for members with the same parent.