
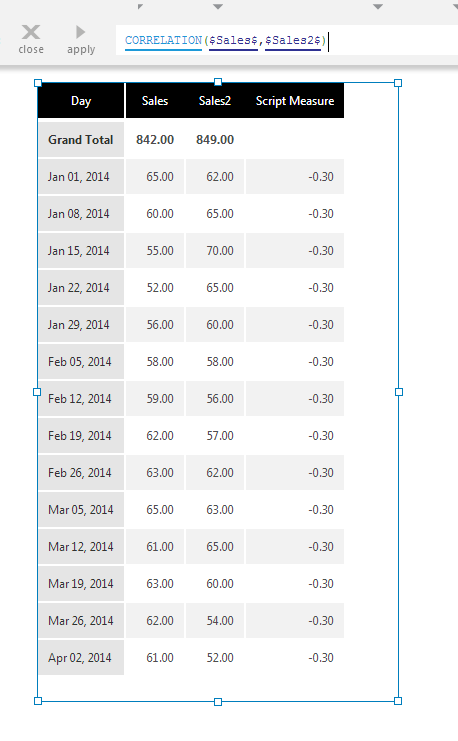
The Correlation function calculates the correlation, or the strength of the relationship between two input data series.
The resulting correlation value ranges between -1 and 1, where a value close to -1 indicates a negative correlation, a value close to 1 indicates a positive correlation, and a value close to zero indicates no correlation. A negative correlation means that when the first input is large, the second input is small (and vice-versa) whereas a positive correlation means the both input values become larger and smaller at the same time.
The Correlation Group function can optionally group the input data and calculate separate correlation values for each.
1. Syntax
Correlation:
CORRELATION(d0,d1,Alignments...)
Correlation Group:
CORRELATIONGROUP(d0,d1,Alignments...)
2. Input
The Correlation functions require the following input series:
- d0: First Input data values - The first set of data values for which the Correlation is calculated.
- d1: Second Input data values - The second set of data values for which the Correlation is calculated.
3. Parameters
The Correlation functions accept the following parameters:
- Alignments... (One or More, Optional) – Hierarchy placeholders to be used as the alignment axis.
- For CORRELATION, specifying a hierarchy calculates the correlation for the corresponding input values separately each time they occur: e.g., CORRELATION($Measure1$, $Measure2$, $Year$) can calculate separate correlation values within each Country group.
- For CORRELATIONGROUP, specify the hierarchies by which to group the input values and calculate the correlation within each group: e.g., CORRELATIONGROUP($Measure1$, $Measure2$, $Country$) will calculate the correlation between Measure1 and Measure2 values separately within each country.
4. Output
The Correlation functions generate the following outputs:
- Correlation - A single value representing the correlation between the two sets of input values (or for each group when using alignment parameters).