
The Correlation Matrix function calculates the strength of the relationships between all possible pairings of the specified data series as values between -1 and 1.
Zero implies that the two series are independent; a value close to 1 implies they are positively correlated, and a value close to -1 implies they are negatively correlated. A negative correlation means that when the first input is large, the second input is small, and vice-versa.
Tip
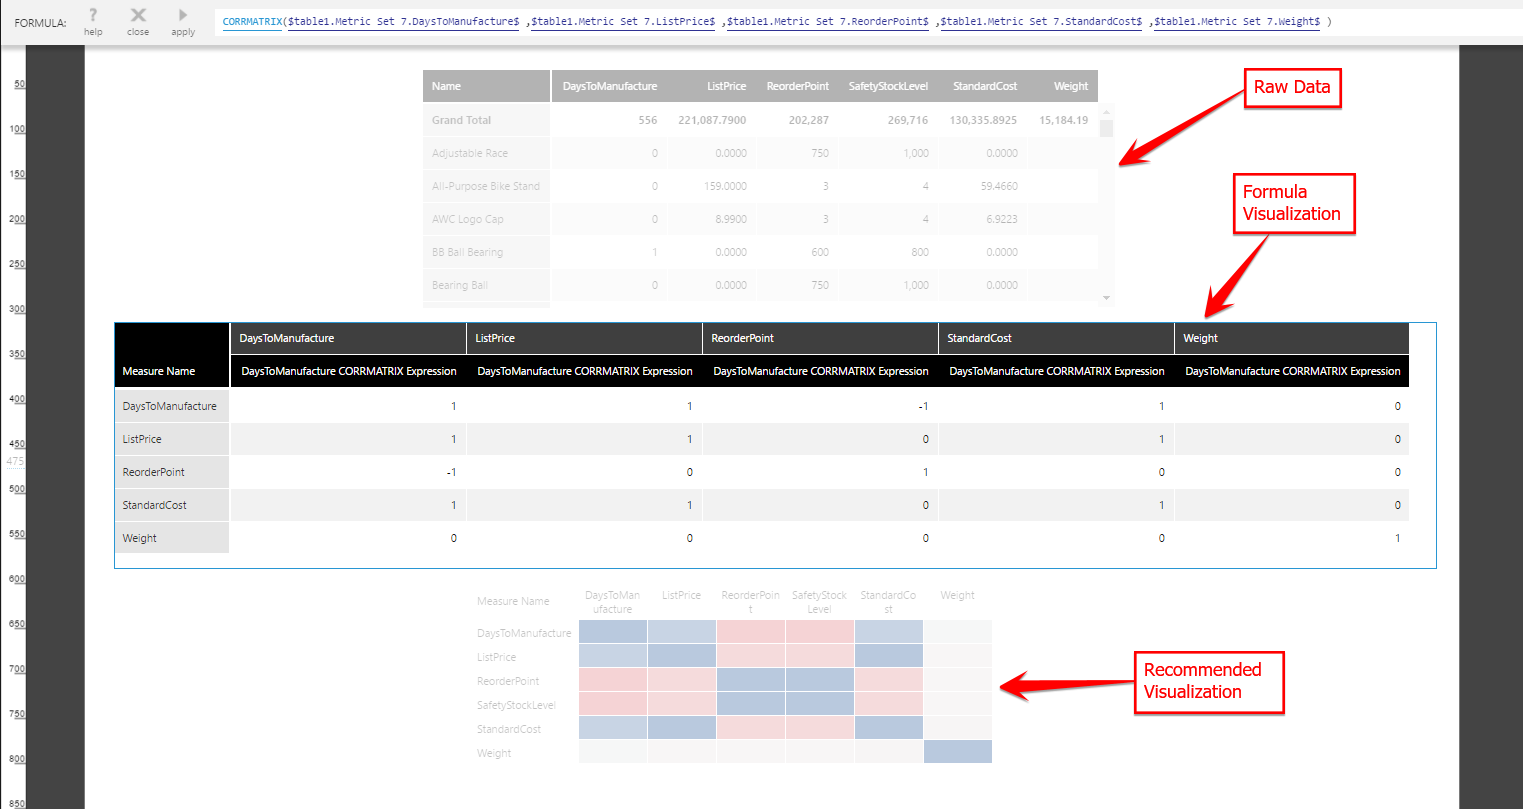
With multiple measures and many rows of data selected, re-visualize to a Correlation Matrix to quickly produce a preconfigured correlation matrix visualization. See Using Dundas BI recommendations for details.
Note
The correlation matrix function can only be used in a formula visualization.
1. Syntax
CORRMATRIX(d0...)
2. Input
The Correlation Matrix requires the following inputs:
- d0 (One or More) - The data series (i.e., measures) for which the Correlation Matrix is calculated. Must contain at least one data series, but should contain multiple for calculating the correlation between each pair.
3. Parameters
The Correlation Matrix does not use any parameters.
4. Output
The Correlation Matrix function generates the following output:
- Correlation Matrix – the Correlation Matrix result set containing a measure with the correlation values between each pair of inputs, a hierarchy of measure names placed on Rows, and a hierarchy of measure names placed on Columns in the metric set.
Note
You are not allowed to change the placement of the hierarchies in the resulting metric set.