
The Trend and Forecasting function calculates a regression line or line of best fit. When applied to a time series, it can forecast future values.
This function can be used with a measure and date/time values, or with two measures where each is typically plotted along a separate chart axis.
There are four regression functions available, which you can choose from when setting the function parameters:
The Upper Band Error and Lower Band Error functions can be optionally used to add upper and lower error boundaries, which increase as the forecast portion of the regression line progresses.
1. Syntax
Trend and Forecasting:
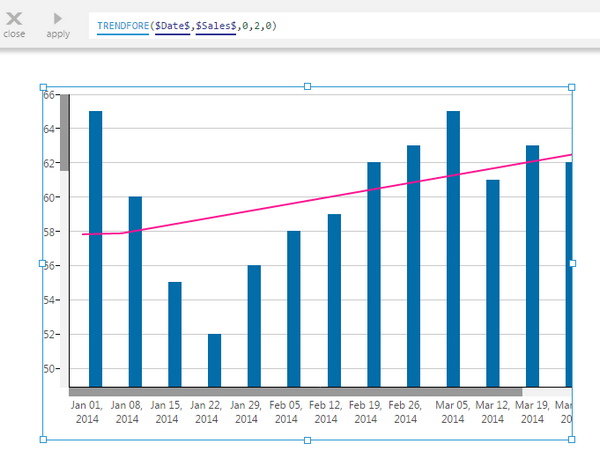
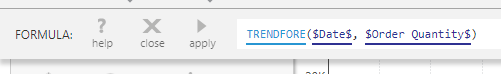
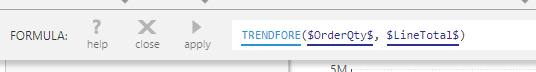
TRENDFORE(d0,d1,s0,s1,s2)
Upper Band Error:
TRENDFOREUPPER(d0,d1,s0,s1,s2)
Lower Band Error:
TRENDFORELOWER(d0,d1,s0,s1,s2)
2. Input
The Trend and Forecasting functions require the following input series:
- d0 - Trend Axis values - The set of values on the trending axis (e.g., the date/time values, or the measure plotted on the X/bottom axis opposite from the input data values).
- d1 - Input data values - The measure for which to determine the trend.
3. Parameters
- s0 - Regression Type - The type of regression function used by the Trend and Forecasting formula. Available choices include:
- 0 - Linear (default)
- 1 - Exponential
- 2 - Logarithmic
- 3 - Power
- s1 - Regression Degree - The degree used by the regression function in calculating the Trend and Forecasting formula. Default value is 2.
- s2 - Forecasting Period - The length of the forecasted data series as returned by the Trend and Forecasting formula. Available choices include:
- 0 - No Forecast
- 1 - Tenth Input
- 2 - Quarter Input
- 3 - Half Input (default)
- 4 - Full Input
4. Output
The Trend and Forecasting functions generate the following outputs:
- Trend and Forecasting - The Trend and Forecasting result set.
- Upper Band Error - The upper error boundary based on standard deviation and the forecasting error.
- Lower Band Error - The lower error boundary based on standard deviation and the forecasting error.
The upper and lower error boundaries are calculated as two standard deviations away from the trend/forecast, plus an additional standard deviation for every step past the original input values when forecasting.
5. Examples
5.1. Trend and forecast on a time series
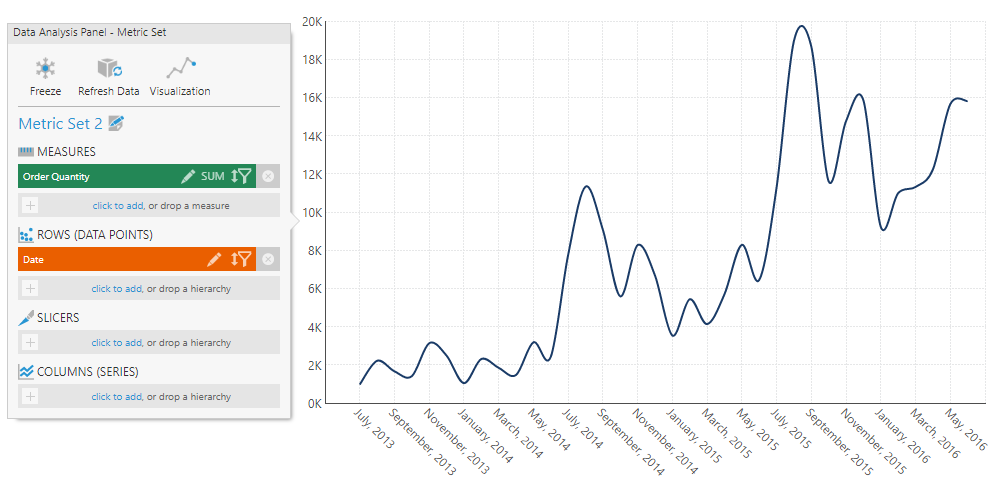
This example adds a trend line including a forecast to a line chart.
With a measure and time dimension hierarchy displayed in a chart like the following:
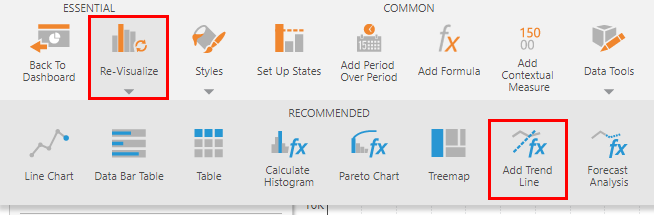
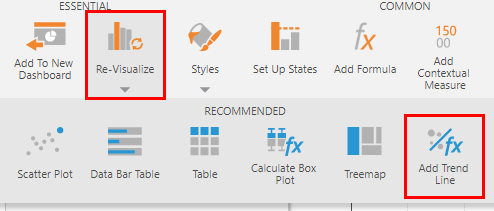
You can quickly add a trend line by choosing Re-Visualize in the toolbar, then Add Trend Line.
This adds a formula measure that uses the TRENDFORE function with the default forecasting settings, visualized as a new line series.
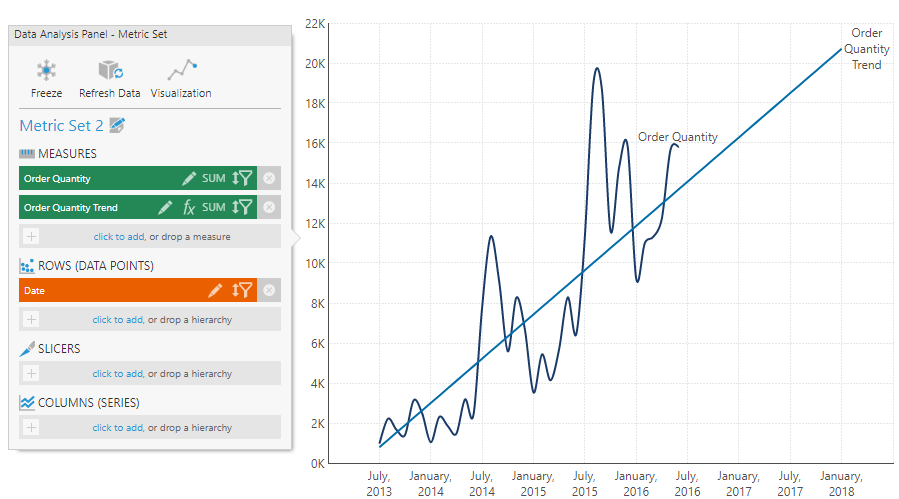
You can now edit the formula if you choose to.
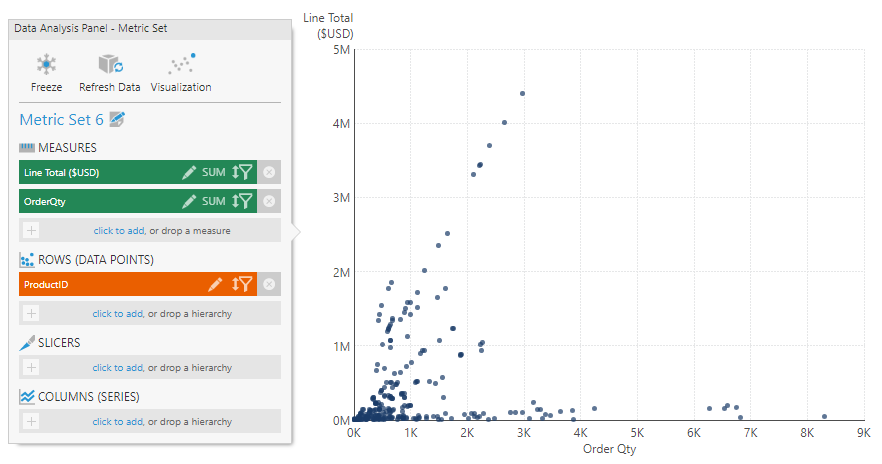
5.2. Linear regression on scatter plot
This example shows how to add a regression line, or line of best fit to a scatter plot.
With a scatter plot chart displaying two measures grouped by one or more hierarchies:
You can quickly add a trend line by choosing Re-Visualize in the toolbar, then Add Trend Line.
This adds a formula measure that uses the TRENDFORE function, visualized as a new line series.
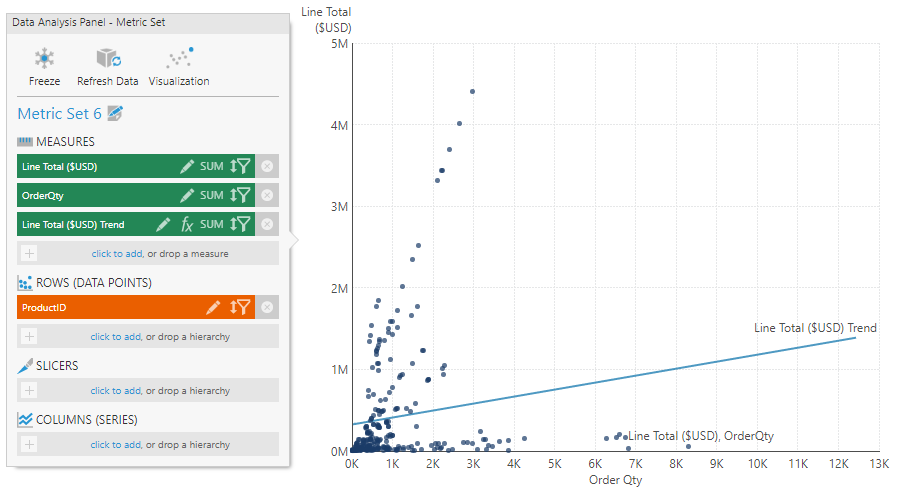
You can now edit the formula if you choose to.
6. See also