The Clustering function uses the K-Means algorithm to group data points based on similarity of the measures provided. Clustering can help identify different groups in your data that should receive special treatment (for example, a defined custom marketing campaign for a certain cluster).
The K-means clustering model partitions a number (n) of observations into a number (k) of clusters, in which each observation belongs to the cluster with the nearest mean.
For more information about the methods used for clustering, see k-Means Clustering, Bisecting k-Means and the Calinski-Harabasz criterion index.
1. Syntax
CLUSTERING(d0,d1,d2,...,s0,s1)
The same syntax can also be used to return the K value with CLUSTERINGK.
2. Input
The Clustering function requires at least one input series, but can take any number of input series:
- d0,d1,d2,... - Measures to be used to compute similarity for clustering.
3. Parameters
- s0 – K – The number of clusters to be created. If no K is provided (or is less than 1), Dundas BI will attempt to automatically select a fitting value.
- s1 – MaxPasses – The number of passes after which to stop if convergence is not reached. The default is 20.
4. Output
The Clustering function generate the following outputs:
- Clustering – The Clustering result set, where each row is assigned a value between 1 and K.
- K – The K factor.
5. Examples
For the following example of using K-Means Clustering, first create a Point chart.
From the Adventure Works OLAP database, drag the Freight Cost measure to the Measures field and the Gross Profit measure to the Horizontal Axis area.
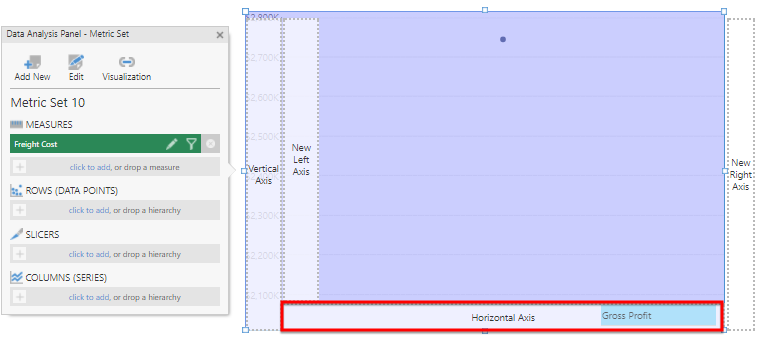
Drag the Product dimension to the Rows field.
From the toolbar, click Data Tools and then select Add Formula.
In the formula bar, type the following and click apply:
CLUSTERING($[Measures].[Freight Cost]$,$[Measures].[Gross Profit]$)

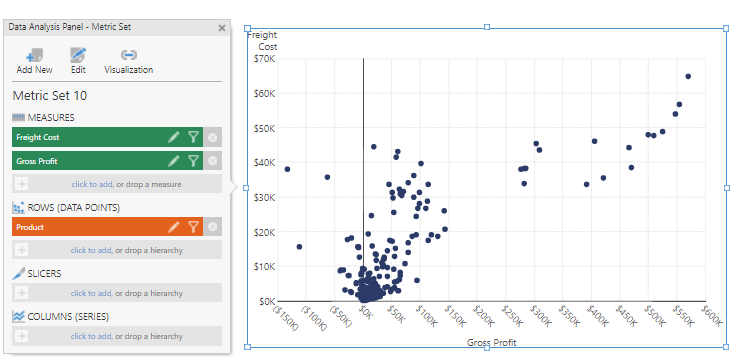
Open the Properties panel and remove the Freight Cost CLUSTERING Expression series for the visualization.
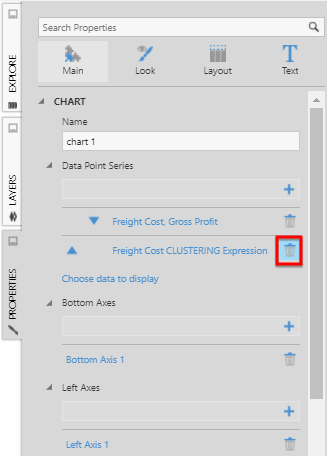
Open the Data Analysis Panel and click Visualization.
Click More... to see more options for the Freight Cost, Gross Profit series.
Under Color, click click to add and select Freight Cost CLUSTERING Expression.
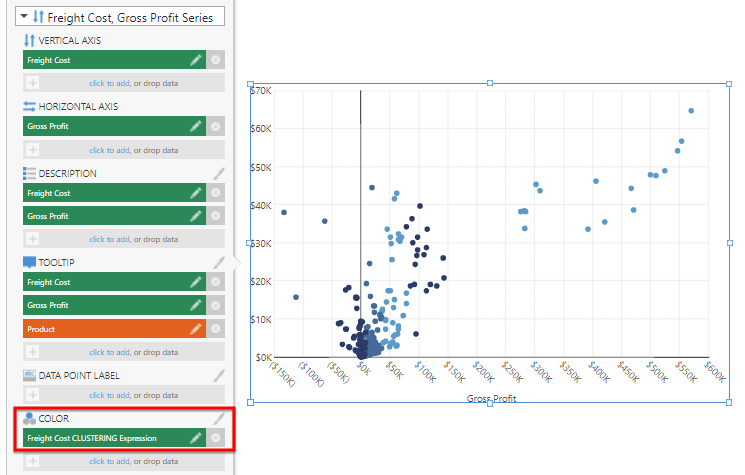
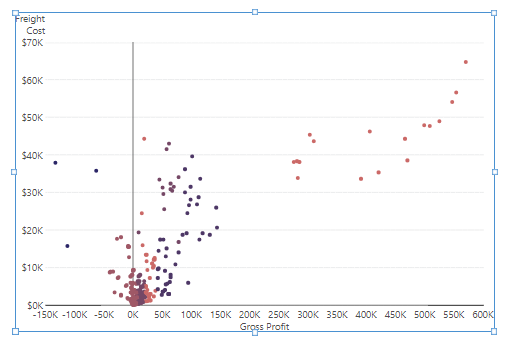
The data in the visualization is colored based on the results of the clustering formula. Click the brush icon next to the Color field to adjust the generated Auto Color Rule.