1. Overview
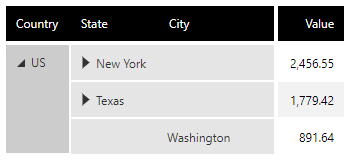
This article demonstrates how to create a ragged, unbalanced, or self-referencing hierarchy. A ragged hierarchy can skip levels, as shown in the image below:
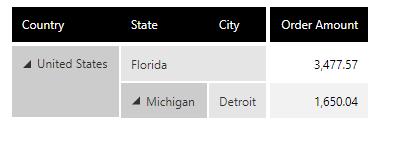
Ragged hierarchies that extend to different levels in each branch are also known as "unbalanced", as shown in the image below:
The number of levels is determined by the data, and may change over time.
2. Data
One structure is used to define a ragged hierarchy. The top level is determined by the rows where the parent ID is empty, while the rest will be based on their parent ID and will appear in one of the levels below the parent.
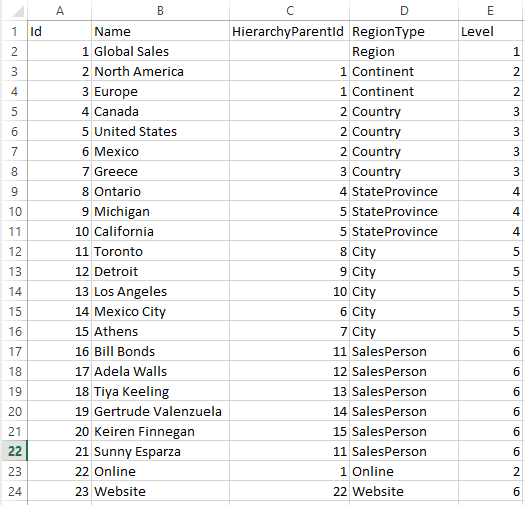
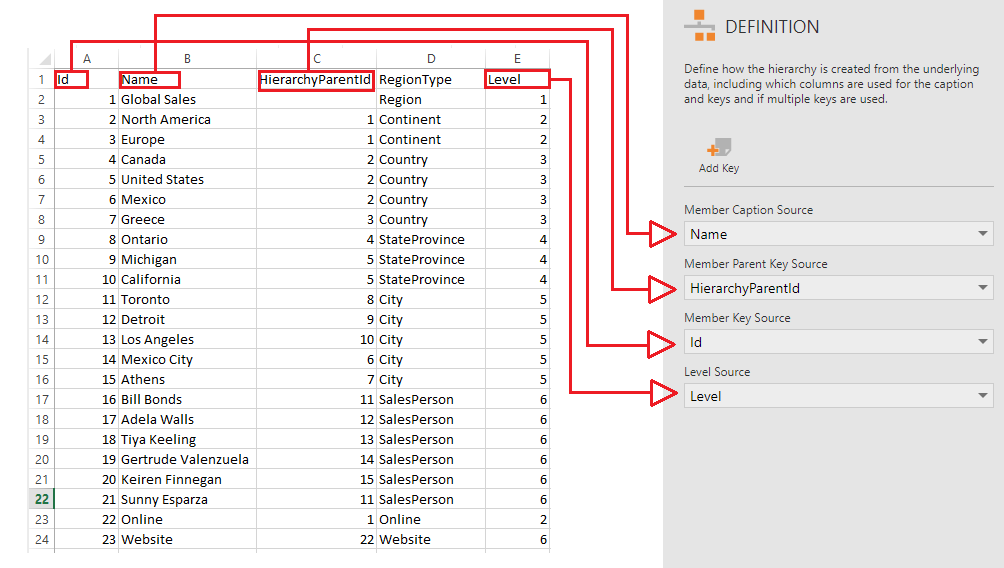
You may also have an optional column of values defining the level of each row, which is what makes it possible to "skip" a level, by placing a value two or more levels below its parent. In the example data above, Mexico City's parent is Mexico in the Country level, even though other cities have a parent value in the StateProvince level.
3. Steps
Create a new Hierarchy from the main menu by choosing Business and the Hierarchy file type, then clicking Create and choosing the Ragged option.
The hierarchy canvas will appear. Drag the data defining the hierarchy onto the canvas from the Explore window.
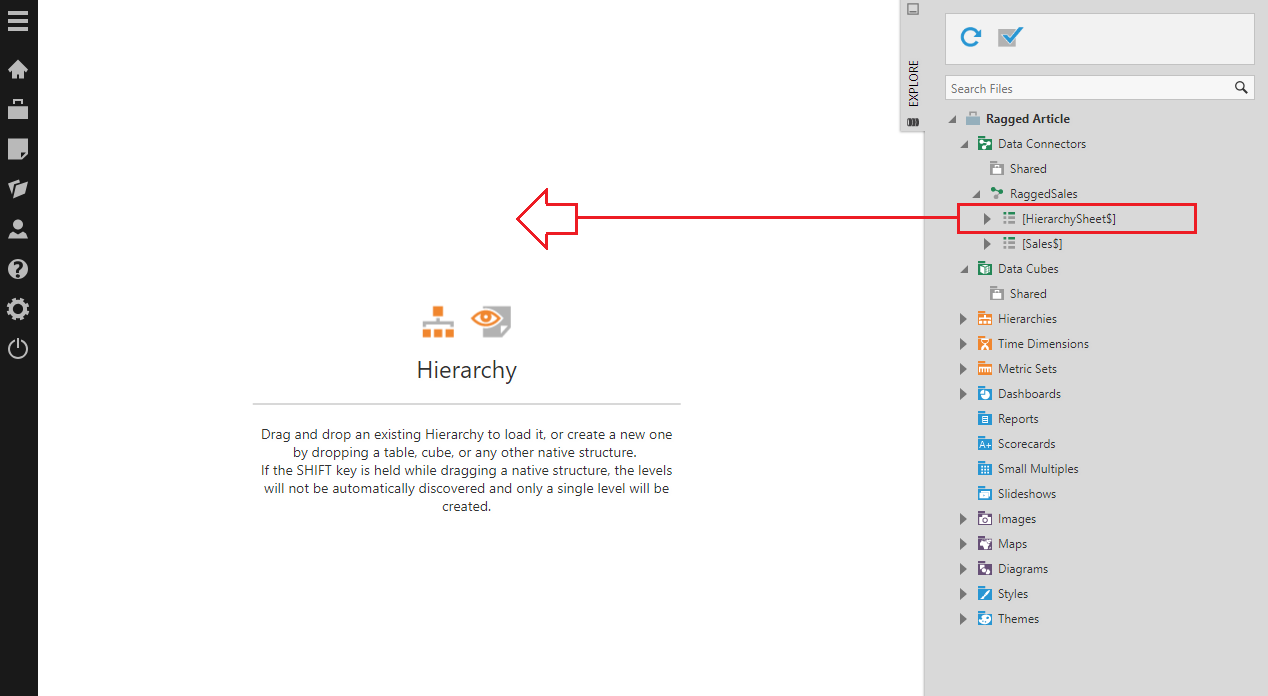
On the left side of the editor under Definition, set up the following:
- Member Caption Source - The values used displayed as the captions to users.
- Member Parent Key Source - The values identifying the parent member's key values.
- Member Key Source - The values that uniquely identify each member. The child member's parent keys must match these.
- Level Source (Optional) - Values that identify the level. This can be un-set, and the levels will be generated based on each member's parent keys. If set, the level will be determined by and named for these values, and it may be possible for a member's parent to be two or more levels above. Level values can be text (string) or numeric.
The figure below shows how our example source data maps to our ragged hierarchy definition.
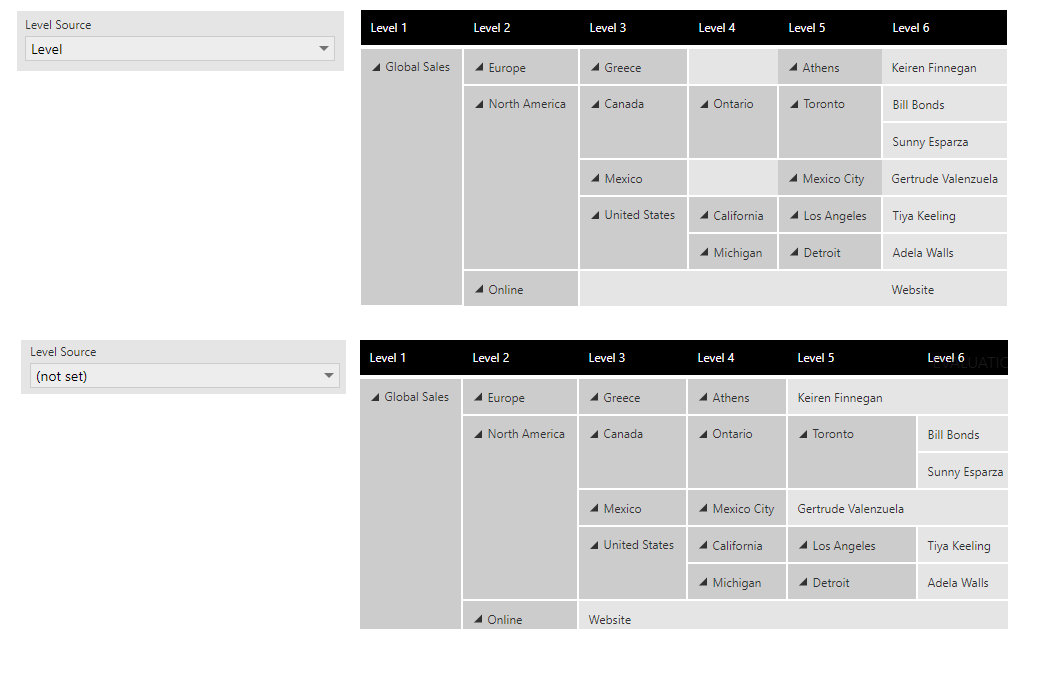
The following image shows two versions of a hierarchy defined with our sample data and used in a table visualization. The first result sets the optional Level Source, while the second leaves it un-set.
You can review the hierarchy in the preview section.
In version 23.3 and higher, click Check Warnings in the toolbar to check for issues such as circular references that could cause an error or other problem later if not avoided.
4. Using the ragged hierarchy
You can use a ragged hierarchy the same way as for a standard hierarchy, replacing a column that can be matched with your hierarchy's keys. See Automatic joins and hierarchies for details on replacing a column with a hierarchy when editing a metric set, dashboard, or other view. You can also promote a column to your hierarchy in the Process Result of a data cube.
The following sections demonstrate how you can visualize and work with a ragged hierarchy selected in your metric set.
4.1. Visualizing levels
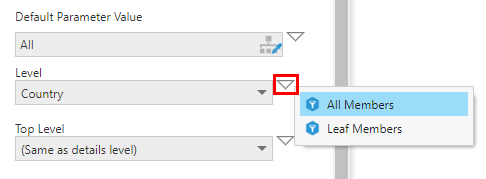
There are special options available when deciding what level(s) to display from a ragged hierarchy in addition to the usual options. To access these, click the hierarchy in the Data Analysis Panel to edit it, and click the token menu to the right of the level dropdown:
- All Members - This option selects all members from all levels at once, applicable for visualizations that can display multiple levels. This can be useful since the number of levels might change over time according to the data.
- Leaf Members - This option displays only the members with no children. This is similar to selecting the lowest level, except that for a ragged hierarchy, these members might be in different levels.
You can also add a Level filter to your dashboard or other view and access these options from its token menu.
4.2. Tables
The table visualization has a layout property called Row Header Layout that can be used to show a ragged hierarchy structure in different ways:
- Separate Columns - Each level's values are shown in their own column.
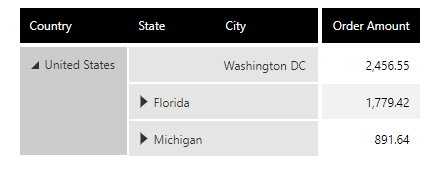
Ragged hierarchy displayed in separate columns - Single Indented Column - All levels are displayed in a single column where each child member is shown indented below its parent.
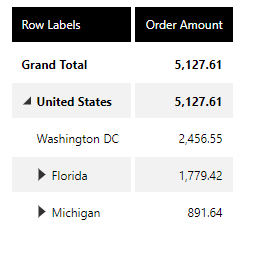
Ragged hierarchy in a single indented column
4.3. Charts
The figure below demonstrates a chart's expander buttons that can be used to expand or collapse the ragged hierarchy's members:
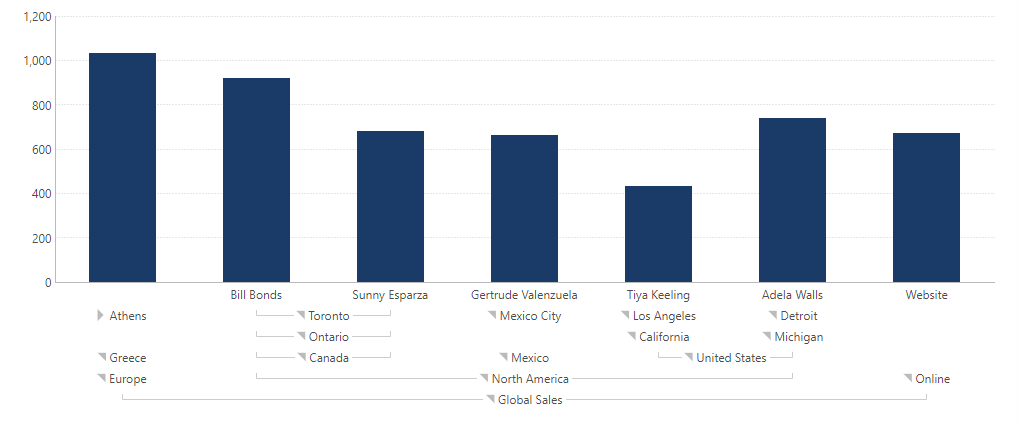
You can choose to set a chart up to initially display multiple levels at once along its axis, with each level in a separate row, as described in Visualization tab examples. By default, an expanded axis label always displays its children directly adjacent.
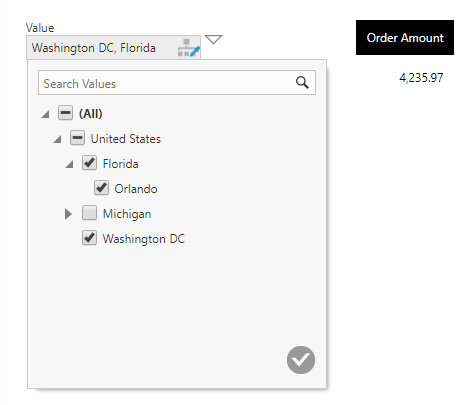
4.4. Filters
A hierarchy value filter allows you to expand each member to view its children, and expand down to different depths depending on whether each member has any members below it.