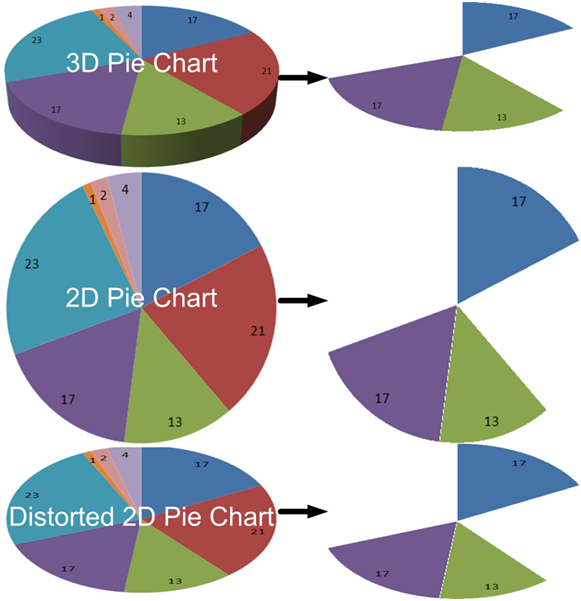
Remember PowerPoint in the 90’s? The near seizure invoking presentations that people put together with slides and text flying in or dissolving from every angle? Huge 3D fonts with massive gradients and colors reminiscent of that time you “accidentally” ate the wrong thing at Woodstock?
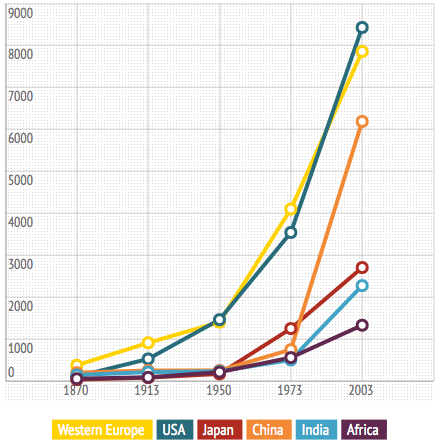
Visualization lets us see things that would rather go unnoticed. In visualizations, we can see patterns that are not (quickly) obvious in the table. It's just one of the many reasons that data visualizations are important.
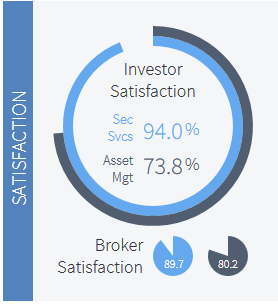
With increasing spending and investment in IT comes increased scrutiny, and CIOs are having to demonstrate greater maturity and expertise in IT performance and financial management to reveal how IT money is being spent, the returns their organization are getting for their spending and investments, and how IT is contributing to overall enterprise performance.
I am a gamer at heart. Video games, board games, card games, I love playing them all. Every successful game is a work of art. It is simultaneously complex and parsimonious. I feel the same can be said about dashboards.

 Remember PowerPoint in the 90’s? The near seizure invoking presentations that people put together with slides and text flying in or dissolving from every angle? Huge 3D fonts with massive gradients and colors reminiscent of that time you “accidentally” ate the wrong thing at Woodstock?