In today’s hyper-competitive world, it’s becoming more and more important for businesses to react to events as soon as they occur, with little to no delay. Whether it’s optimizing call center response times and quality of responses to improve customer satisfaction, detecting and preventing fraud at the point of sale, or targeting individuals with promotions as they enter physical or online stores, reacting to events as they occur helps businesses to make tactical decisions immediately and prevent any problems that may arise due to inadvertent delays.
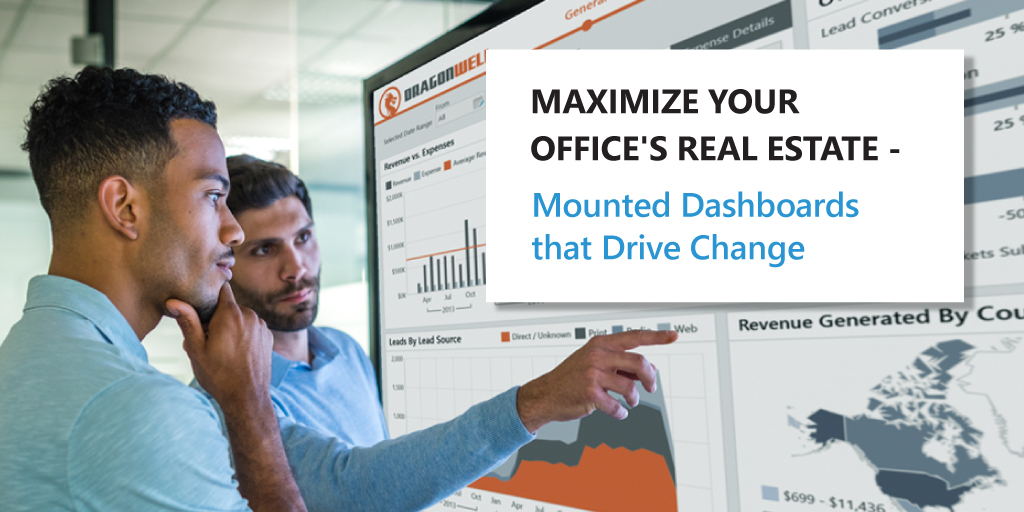
Wall-mounted dashboards, Wallboards, or simply put, “Dashboards on large screens on your office walls”, are a great way ensure key business metrics are made visible at prominent locations in the communal office space.
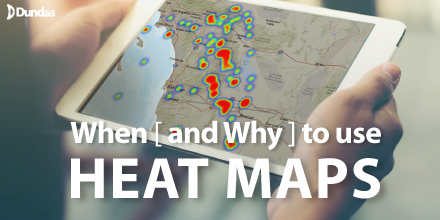
When you hear the term “Heat Maps”, what comes to mind? Do you immediately think of something related to financials? Or are you drawn to forecasts you’ve seen on weather networks? Maybe you’re an out-of-the-box thinker and think of website tracking and tools to optimize conversions?
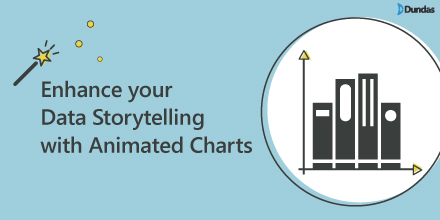
The biggest value of data visualizations is the ability to see insights in your data that you cannot see otherwise. For example, observing data changes over time allows you to gain insights on past behavior in your data and make decisions based on it.
No two Independent Software Vendors (ISVs) are the same. Each differs in what it offers, in its size, in the talent it secures, and in its culture. However, what each ISV shares, is an innate desire and drive to create and develop exceptional products and solutions that are: A) Superior to their competition, and B) Endeared by their customers.