
1. Overview
This article shows you how to use a slider filter to select a single or a range of numeric values.
2. Filtering a numeric range
For this example, create a new dashboard using the Blank template.
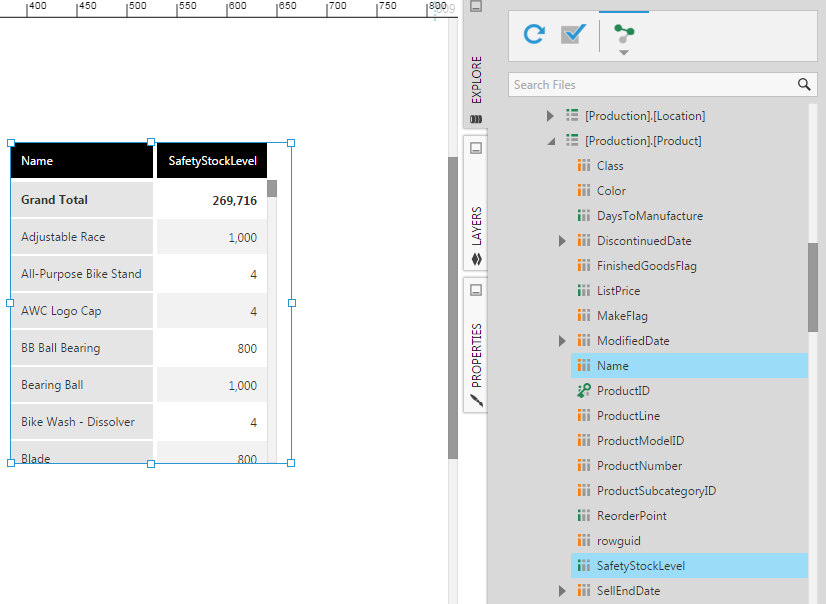
Drag a measure (SafetyStockLevel) and a row hierarchy (Name) from the [Production].[Product] table in Explore.
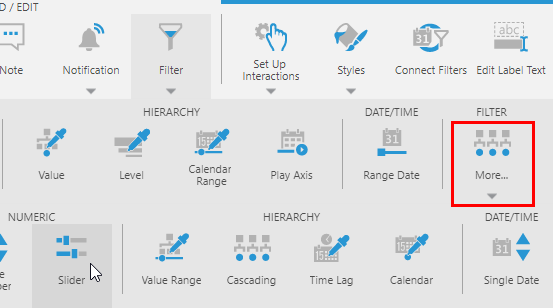
Click Filter in the toolbar, and then select Slider (found under More).
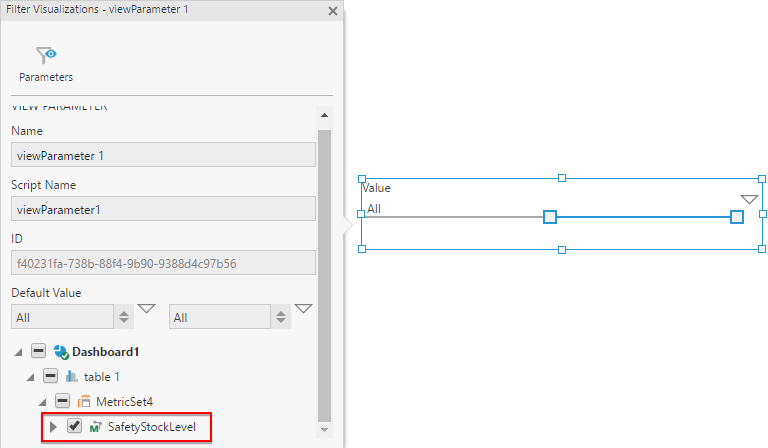
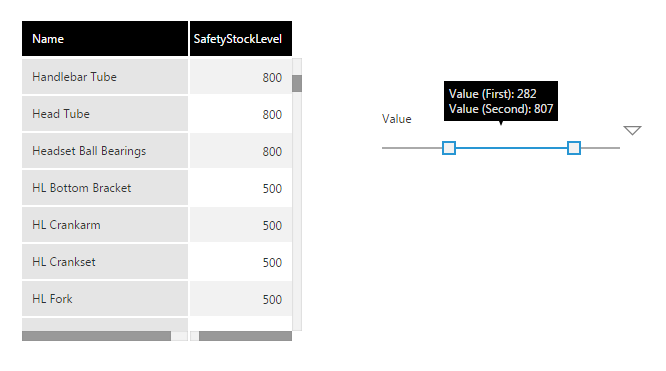
The Filter Visualizations panel for the slider filter shows that it is already connected to the SafetyStockLevel measure.
The Slider filter supports selecting a range of numeric values, which is why it shows two slider handles in this scenario. The minimum and maximum values of this numeric range need to be set next (unless the defaults of 0 and 100 are appropriate for your data).
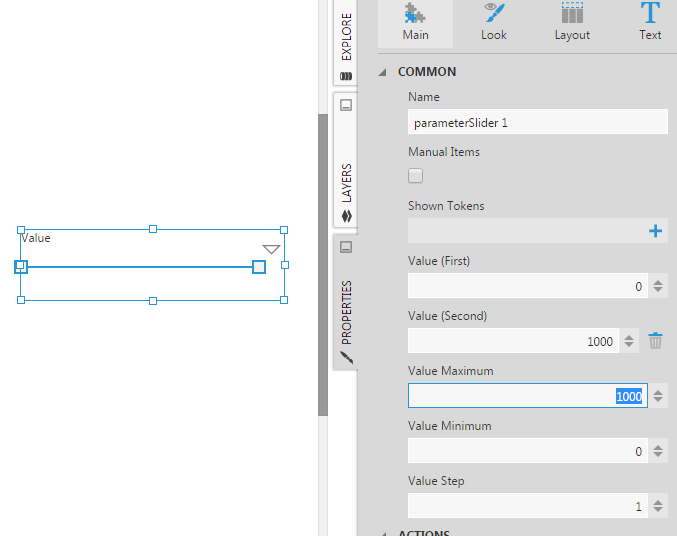
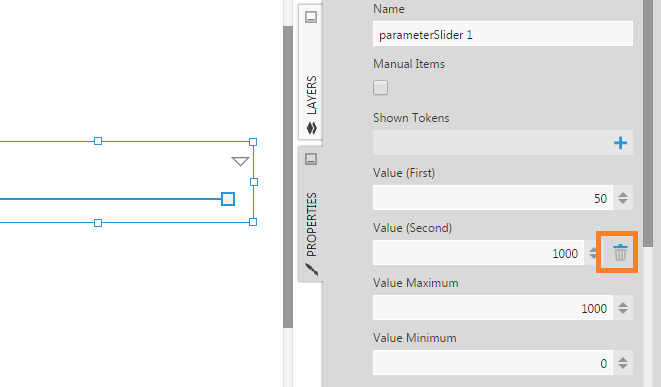
Go to Properties for the slider filter, and for example:
- Set Value (First) to 0 - This is the first slider (handle) value.
- Set Value (Second) to 1000 - This is the second slider value (if slider is in range mode).
- Set Value Maximum to 1000 - This is the maximum value of the slider.
Switch to View mode from the toolbar and start using the slider. Hover over the range portion of the slider to see the current first and second slider values displayed in a tooltip.
3. Filtering a single numeric value
To change the previous example to a single-valued slider, the easiest way is to go to the Properties window for the slider and delete the Value (Second) item.
Another approach is to start from the beginning and add a Single Number filter first. This will automatically give you an associated view parameter (viewParameter 1) that supports a single value. Next, delete the Single Number filter but say no when it asks if you want to delete associated view parameters. Add a Slider filter. In the Filter Visualizations panel, click Parameters in the top-right and connect to viewParameter 1 instead.
4. Properties
The following are some additional properties available to customize in the Properties window:
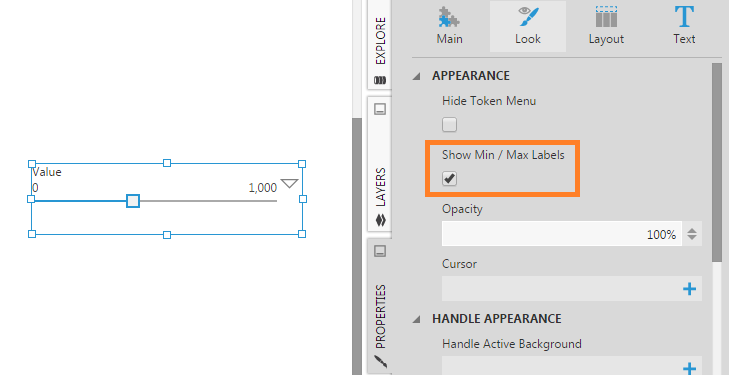
4.1. Show Min / Max Labels
In the Design tab under Font & Text (previously in the Look tab), use the Show Min / Max Labels property to display the minimum and maximum slider values as labels.
4.2. Vertical Layout
Under Layout & Spacing, use the Vertical Layout property to orient the slider filter vertically instead of horizontally.