
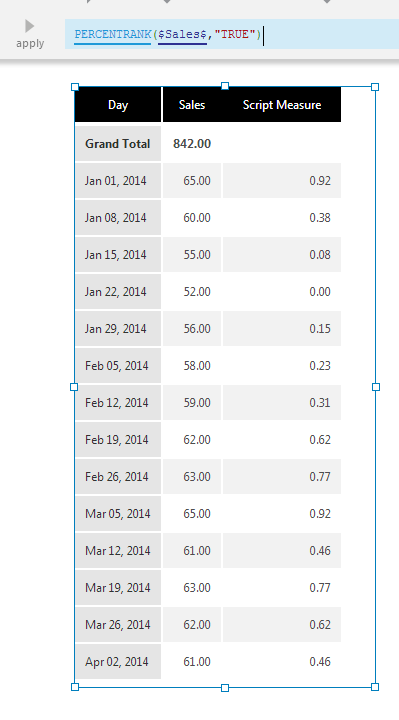
The Percent Rank function calculates the percent rank for each value in a set of input values. Specifically, the function computes the percentage of all input values that are less than a given input value. Percent Rank values range between 0 and 1.
The Percent Rank Group function can be optionally used to calculate the percent rank for each value in sets of input values grouped by the specified hierarchies.
1. Syntax
Percent Rank:
PERCENTRANK(d0,s0,Alignments...)
Percent Rank Group:
PERCENTRANKGROUP(d0,s0,Alignments...)
2. Input
The Percent Rank function requires the following input:
- d0 - The set of data values for which the Percent Rank is calculated.
3. Parameters
The Percent Rank functions require the following parameters.
- s0 - Indicates whether to include the two extreme percent values in the calculation. Default value is True.
- Alignments... (One or More, Optional) – Hierarchy placeholders to be used as the alignment axis.
- For PERCENTRANK, specifying a hierarchy calculates percentage ranks for the corresponding input values separately each time they occur: e.g., PERCENTRANK($Measure$, $Year$) can calculate separate percent ranks for yearly values within groupings for another hierarchy such as Country.
- For PERCENTRANKGROUP, specify the hierarchies by which to group the input values and calculate percentage ranks within each group: e.g., PERCENTRANKGROUP($Measure$, $Country$) will calculate the percentage ranking for each value within each country.
4. Output
The Percent Rank functions generate the following output:
- Percent Rank - The Percent Rank result set.