
Using SSAS roles impersonation
1. Overview
Microsoft SQL Server Analysis Services (SSAS) relies on Windows authentication and roles to determine user permissions. When you create a new data connector using the SSAS data provider, you have the option of connecting using Roles Impersonation, which allows you to control access to cube data on a per-user basis. Users will see different data displayed on dashboards, for example, depending on the user group and corresponding SSAS role they belong to (row-level security).
The idea behind roles impersonation is simple and basically consists of three parts:
- Set up roles in SSAS and restrict access to data accordingly for each role.
- Create user groups in Symphony or Dundas BI that correspond exactly to the SSAS roles.
- Connect to SSAS using the Roles impersonation option.
The following sections walk through an example of creating and using roles and corresponding groups. For more information about SSAS roles, see Roles and Permissions (Analysis Services) in Microsoft's documentation.
2. Set up roles in SSAS
Launch SQL Server Management Studio and connect to Analysis Services.
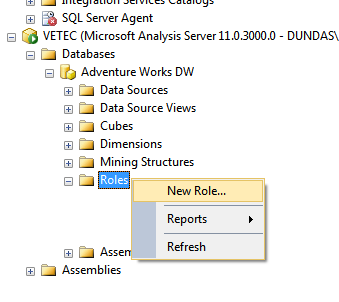
Expand your SSAS database and right-click on the Roles folder. From the menu, select New Role.
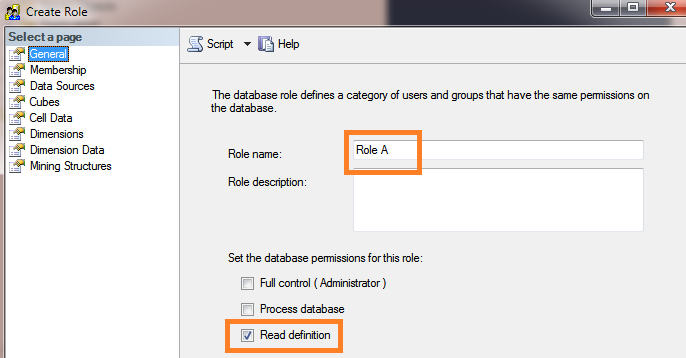
In the General page of the Create Role dialog, set the following fields:
- Role name: Role A
- Set the database permissions for this role: Read definition
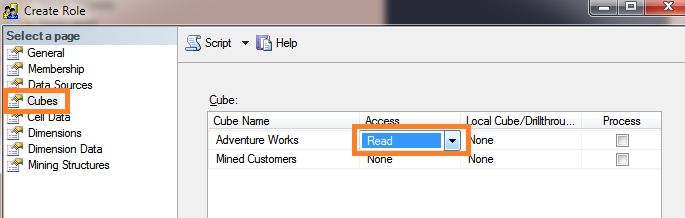
Go to the Cubes page of the Create Role dialog and give read-access to a specific cube.
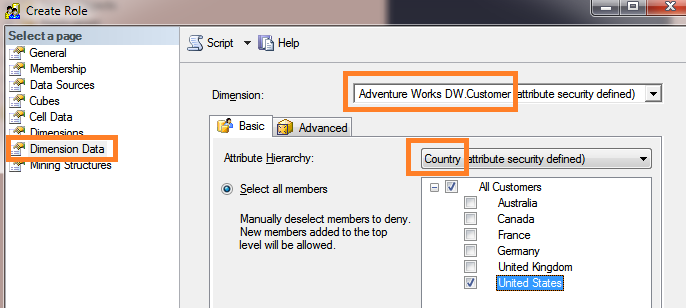
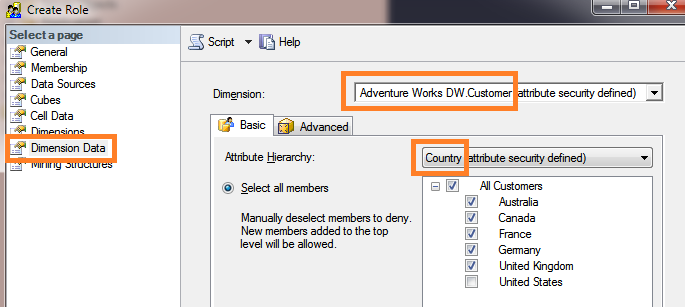
In the Dimension Data page, restrict access to cube data for this role. For example:
- Select the Customer dimension.
- Select the Country attribute hierarchy.
- Uncheck all members except United States.
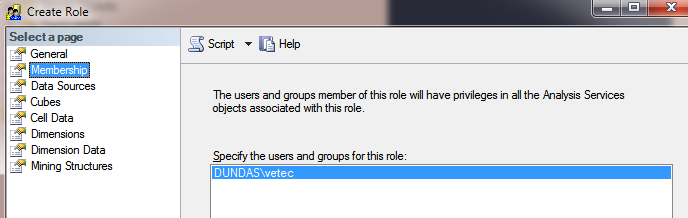
In the Membership page, add a domain user to the role. This will be the Windows credentials needed when creating the data connector.
Click OK in the Create Role dialog to finish creating Role A.
Next, follow the same steps as above to create Role B. The only difference is in the Dimension Data page where you'll want to restrict access to different cube data for the role. For example:
- Select the Customer dimension.
- Select the Country attribute hierarchy.
- Check all members except United States.
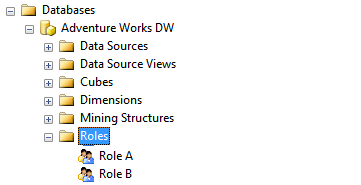
Refresh the SSAS database node to see the two roles.
3. Set up user groups and accounts
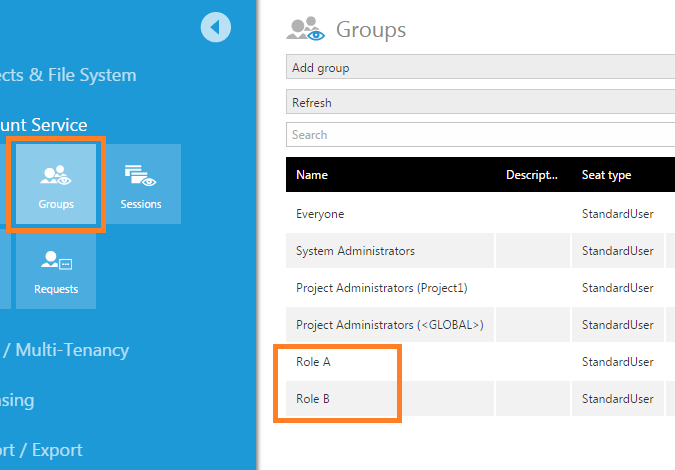
Go to Administration while logged on as an administrator, then expand Account Service and click Groups.
For each SSAS role, create a corresponding group with the exact same name as the role.
Note that role/group names cannot include any characters from this list:
. , ; ' ` : / \ * | ? " % $ ! + = ( ) [ ] { } < >
The underscore (_) character is allowed.
Next, create a new user account named User A and add this as a member of the group Role A.
Similarly, create a new user account named User B and add this as a member of the group Role B.
4. Create a new project and dashboard
For this example scenario, we log on as an administrator and create a new project set up as accessible to all users. Make sure this is the active project.
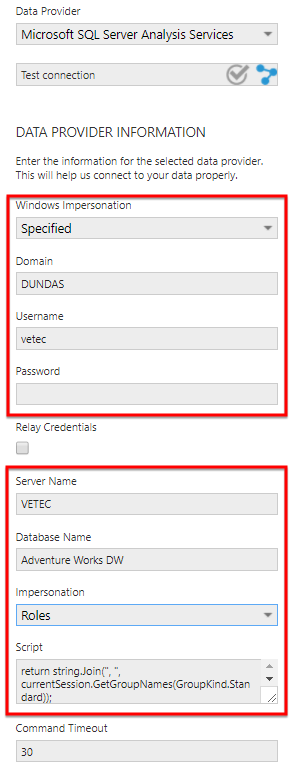
Create a new data connector using the SQL Server Analysis Services data provider:
- Set Windows Impersonation to Specified and enter the domain credentials that were added to the SSAS Membership pages.
- Set the Database Name to the name of the SSAS database.
- Set the Impersonation field to Roles.
- Leave the Script field at its default setting. This C# script returns the names of the groups the current user belongs to (excluding built-in groups such as System Administrators and Everyone).
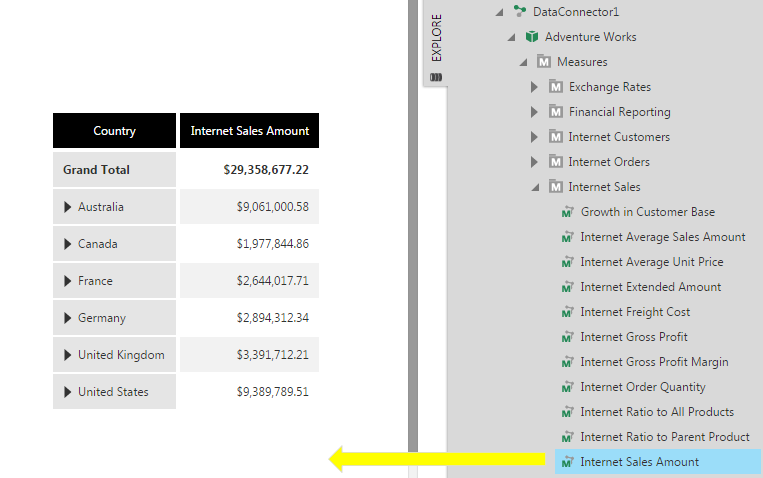
Then create a new dashboard by dragging the Internet Sales Amount measure and the [Customer].[Customer Geography] hierarchy from under the data connector to the dashboard canvas.
Check in the dashboard.
5. View the dashboard as each user
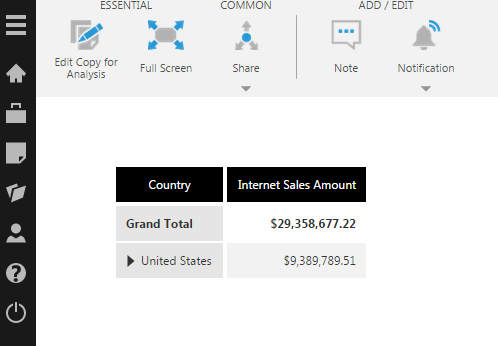
Log out and log back on as UserA.
View the dashboard created above and observe that it displays restricted data corresponding to SSAS Role A.
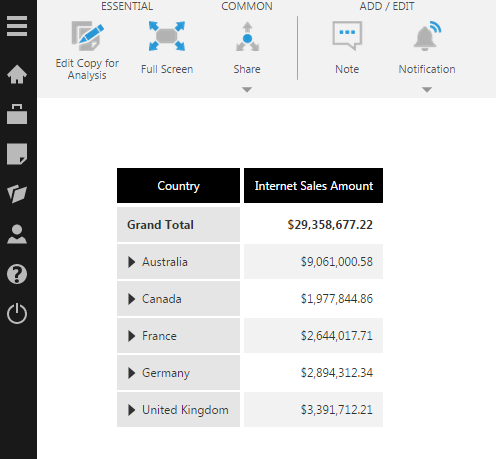
Log out again and log back on as UserB.
View the dashboard and observe that it displays restricted data corresponding to SSAS Role B.
6. See also
- Security overview
- Connecting to SSAS
- Accounts
- Groups
- Writing data scripts with DundasScript
- Using custom data and custom attributes to filter SSAS data
- Using security hierarchy to filter SSAS data by user
- Manage projects and the file system
- Connect to OLAP data and apply a formula
- Tenant overrides
- SSAS Data Connection Issues
- Microsoft Docs: Roles and Permissions (Analysis Services)