1. Overview
Relationships allow you to work with data from multiple data sources as if they had already been prepared into a single data cube for you. For example, with relationships defined, data from an Excel file and a SQL table can be selected together and automatically joined, even if the matching columns have different names.
You can use the Relationships dialog to review existing relationships and add new ones. These are used when selecting data in a metric set, or when creating a multi-level hierarchy.
2. Review existing relationships
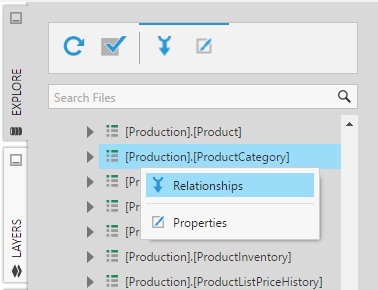
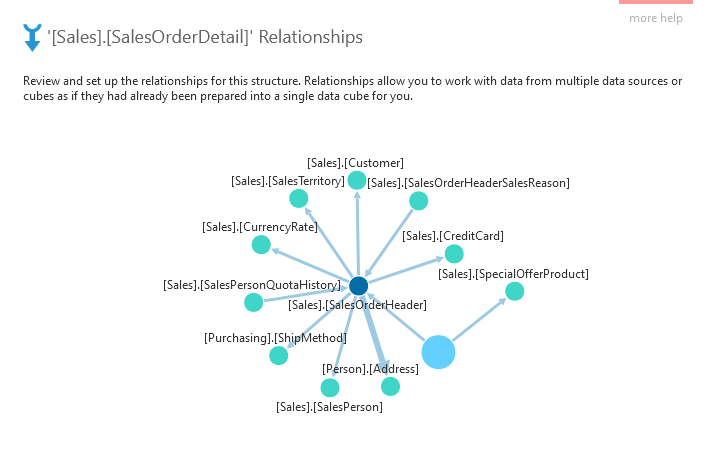
In the Explore window, right-click on a table, data cube, or other data structure and choose Relationships.
In the Relationships dialog, you will see a diagram displaying the existing relationships between that data structure and others.
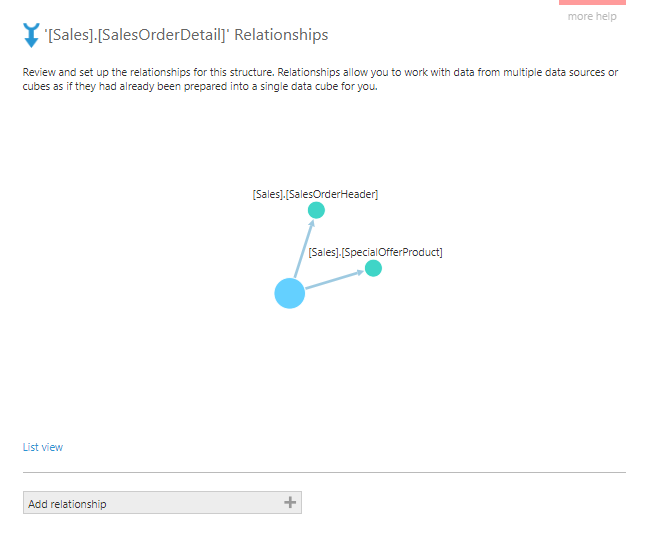
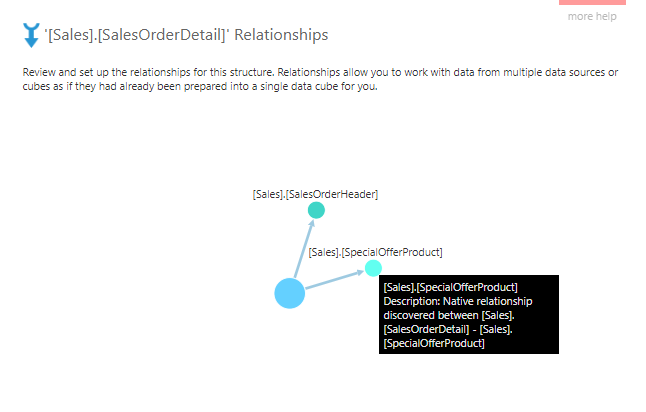
Hover over or long-tap a node (circle) to view details about how it's related in a tooltip.
For each node in the diagram, you can right-click (or long-tap) and choose Expand to add all of the additional related data to the diagram. This allows you to explore and discover other relevant data that can be made available by the intermediate data structures.
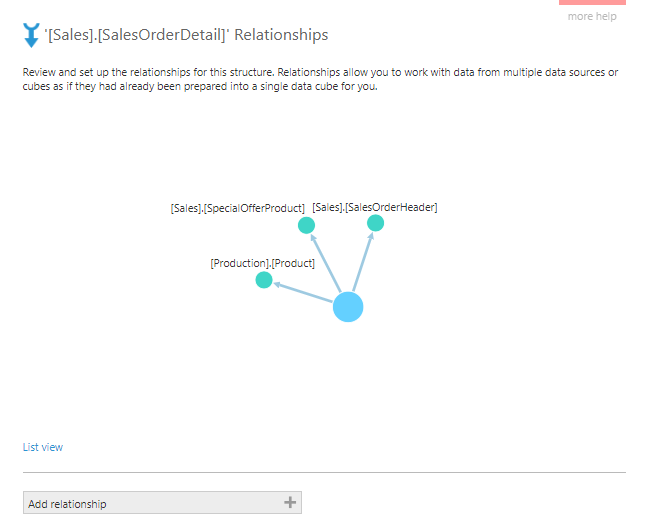
If needed, to view the relationships as a list, click List view. The Category column displaying in list view indicates how each relationship was created:
- Native relationships are defined in the database (e.g., foreign keys).
- System-defined relationships were created automatically prior to version 7.
- User-defined relationships were created by a user.
Return to Diagram view, then right-click a node and click Edit to see its details.
3. Create a relationship
By creating a relationship ahead of time, you can define how two tables or other data structures are related rather than allow this to be chosen for you when you or others drag data from those two onto one metric set.
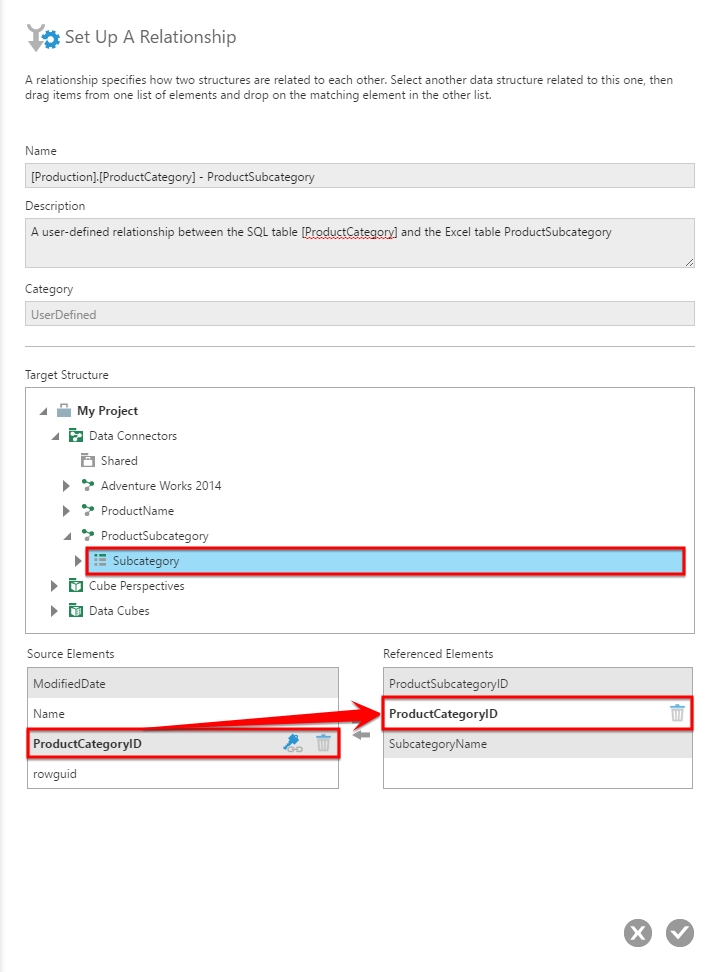
- Starting in the Relationships dialog opened as described above, click Add relationship to open the Set Up Relationship dialog.
- Enter a Name for the relationship and an optional Description.
- In version 25.4 and higher, optionally change the Join Type ahead of time. Otherwise and in earlier versions, the join type will be Inner by default, but you can edit the automatic join afterward.
- Under Target Structure, find the data connector containing related data and select the related table. This data can be from a different data source.
- Match elements from each structure by dragging one from the left under Source Elements to the equivalent under Referenced Elements.
- Click to Save at the bottom of the dialog.
The new relationship will now be added to the diagram in the Relationships dialog as a user-defined relationship.
4. Using relationships
Relationships are used when selecting data from different tables and structures in a metric set, whether in the full-screen metric set editor or when working with metric sets on a dashboard or another view. They are also used when creating a hierarchy that contains multiple levels.
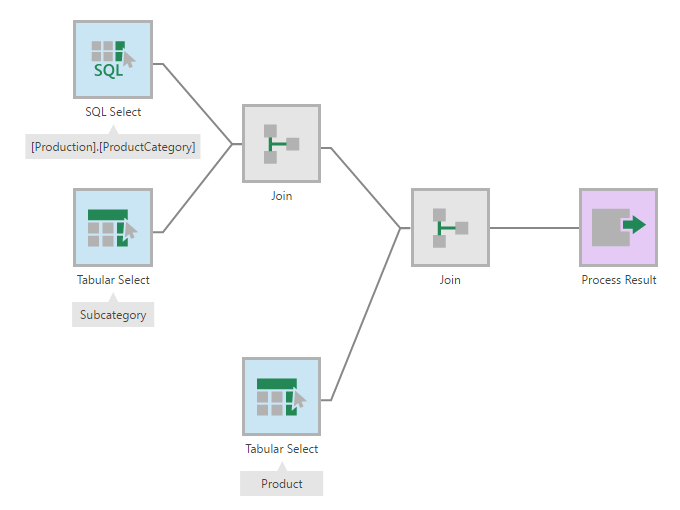
To demonstrate, we will create a single metric set as shown below based on a database table and two Excel spreadsheet files, after relationships have been defined.
In a new dashboard, drag a column from the table [Production].[ProductCategory] to the canvas.
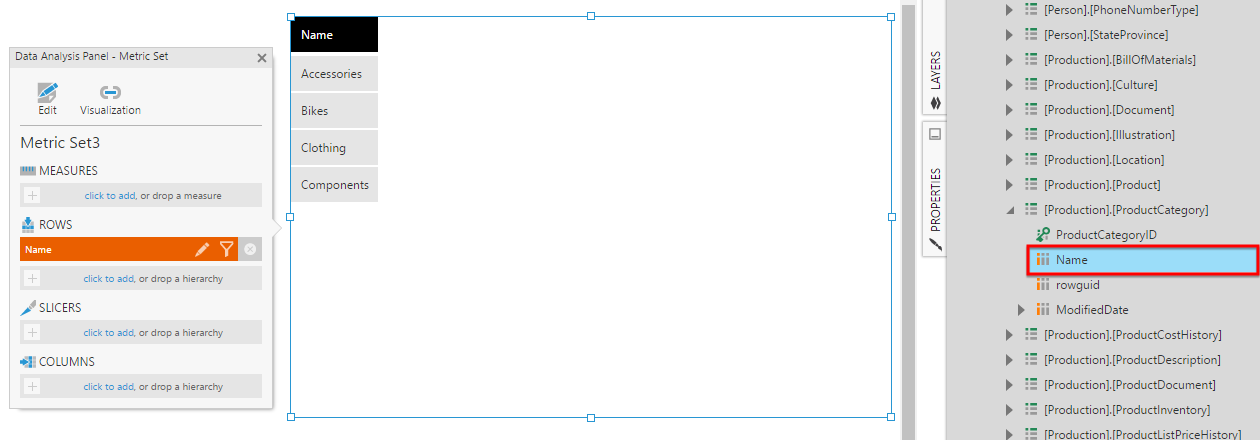
Drag a column from an Excel sheet to Rows in the Data Analysis Panel.
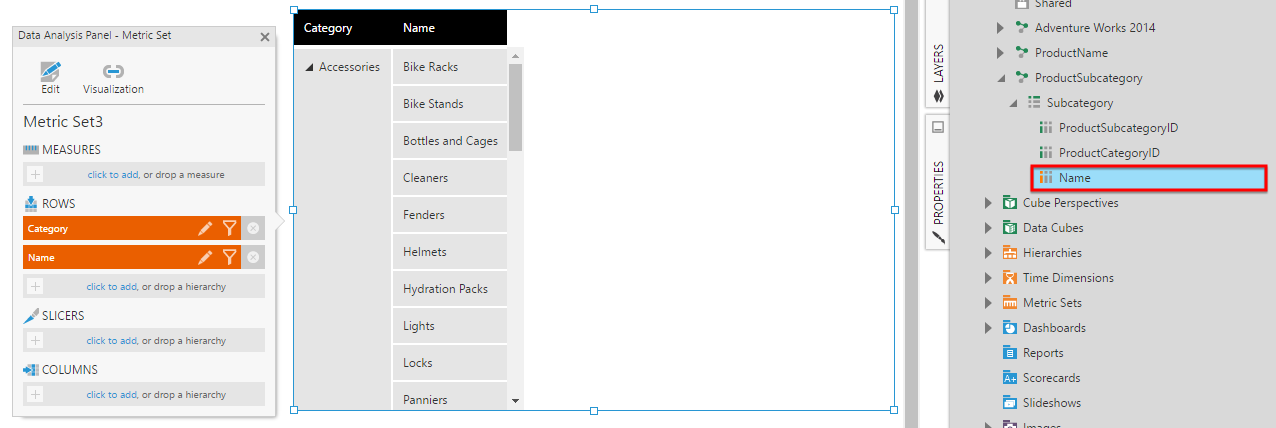
Drag a column containing additional details from a different Excel data connector.
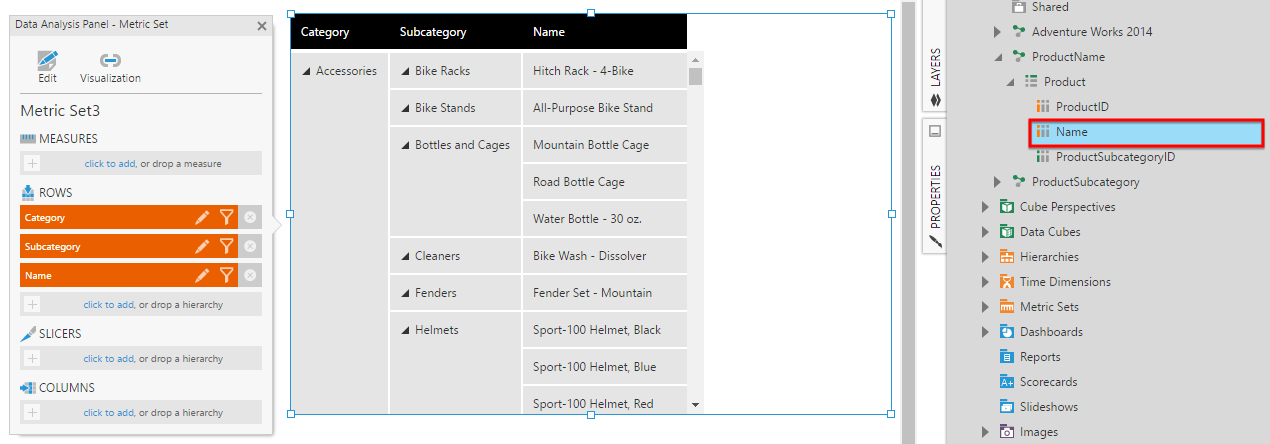
In the background, this created automatic joins between the three tables based on the created relationships. The Automatic joins and hierarchies article shows you how you can view and edit the automatic joins, along with more examples of combining data.
You can also view these joins by promoting the auto-generated metric set if applicable, and then promoting the auto-generated source data cube behind the metric set. Edit this data cube (as a Developer user) to see the join transforms.