
1. Overview
Formula visualizations allow you to use data from one or more visualizations to produce a new metric set (called a formula metric set) in a new visualization. These can be useful for a variety of analysis tasks, and can be created without leaving the editor of your dashboard or other view.
Related video: Formulas
2. Creating a formula visualization
Formulas used to create a formula visualization are the same as formulas used when adding a formula measure, except the result is displayed in a separate metric set.
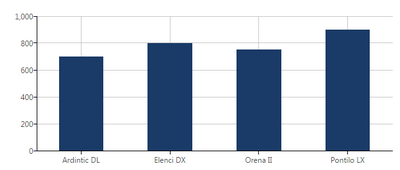
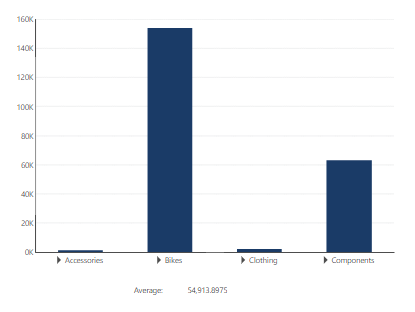
As a simple example, suppose you have a bar chart on a dashboard that shows the List Price of each product, and you want to display the Average List Price in a data label.
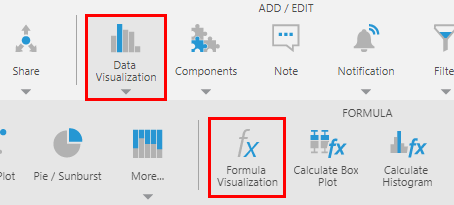
In the toolbar, click Data Visualization and select Formula Visualization under Formula.
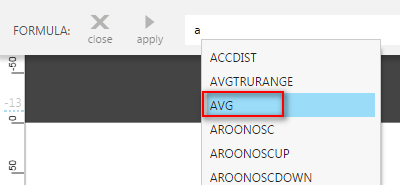
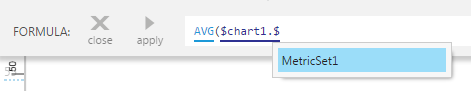
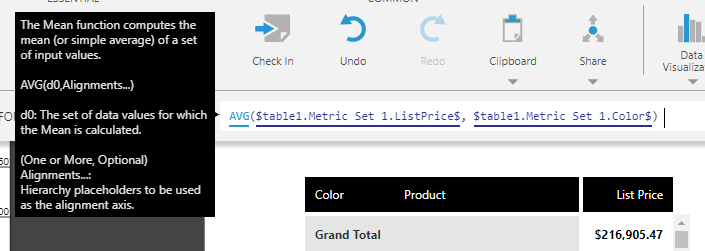
Enter a formula in the formula bar. In our example, we will type the first letter of the formula function AVG and select it from the list of available functions.
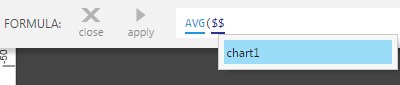
Click on data values in a visualization to insert that data into your formula. This can be from any visualization, and its placeholder in the formula will include its visualization and metric set names.
Alternatively, you can enter the placeholder for some data yourself, beginning with a dollar sign ($), then choosing the visualization name.
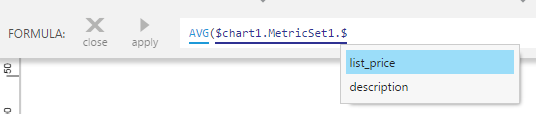
Type a period character (.) and then from the menu, select the metric set from the list of metric sets on that visualization (in some cases there may be multiple).
Type a period character (.) and then from the menu, select from the list of the visualization's measures and hierarchies.
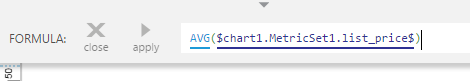
Type a closing parenthesis to complete the formula and press Enter or click apply.
The result of this formula is a new metric set displayed in a new visualization, which is initially a table.
In our example, a single measure value in a single row is included, because that is all that is output by the AVG formula we entered.
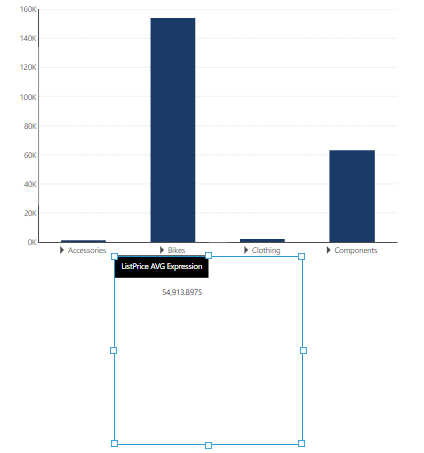
You can choose to re-visualize this new metric set. In our case, with the table selected, we will choose Re-Visualize in the toolbar and then Data Label. You might then want to choose Components and then Label, and set its text to "Average:" to display to the left of the data label.
3. Combining data from multiple visualizations
Formula metric sets can also be created based on the data from multiple metric sets. Normally, this will only make sense when those metric sets are using the same hierarchy or a time dimension hierarchy — the rows will be matched up when possible, and the data combined.
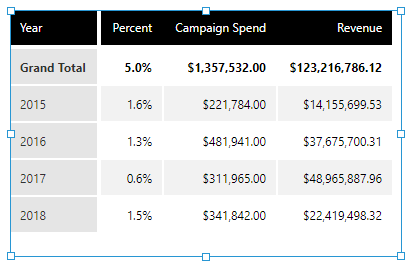
As an example, suppose we have two line charts on a dashboard: one displaying revenue over time from a database, and another with campaign spending over time from an Excel spreadsheet. We have dragged the same default time dimension hierarchy onto the dates in both charts.
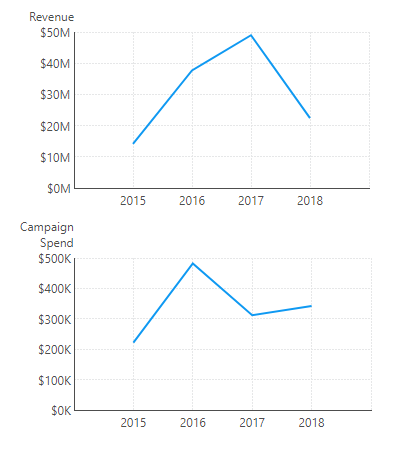
Suppose we want to calculate what percentage of our revenue each year is spent on marketing campaigns.
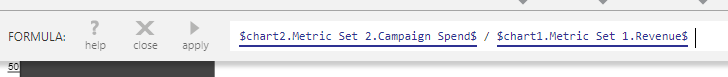
Choose Data Visualization in the toolbar and then Formula Visualization to open the formula bar, and enter a formula that refers to a measure from each metric set to combine them.
In our example, we click the Campaign Spend line in the chart to insert it into the formula, type a forward slash ( / ) to divide it, then click the Revenue line in the other chart to insert it as the divisor.
Click apply to create the new formula metric set and visualization.
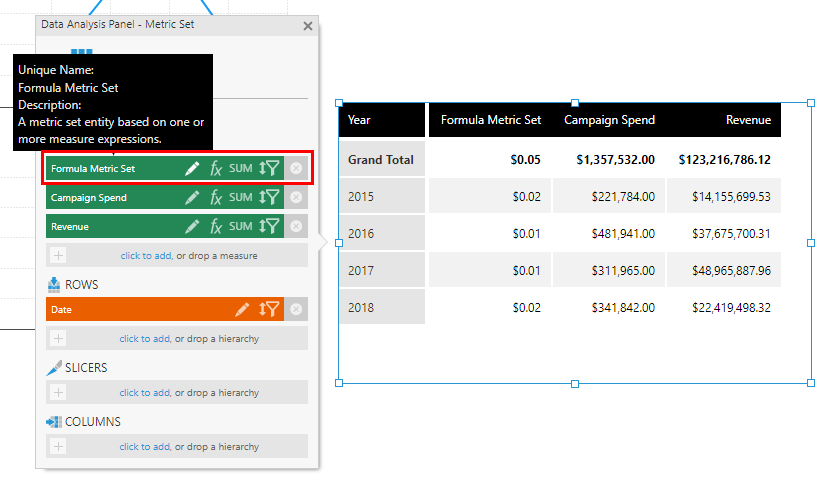
Since we have calculated a percentage in our example, we will want to click to edit the formula measure in the Data Analysis Panel. We can change the Caption and also set its Format to P1, to format it as a percentage with one decimal place.
4. Grouping and aggregating
Many formula functions have optional alignment arguments, which can change how the function groups data, and can result in multiple rows or columns of data instead of just one.
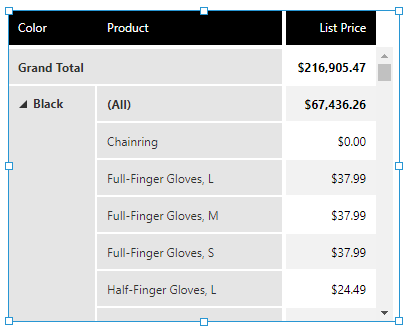
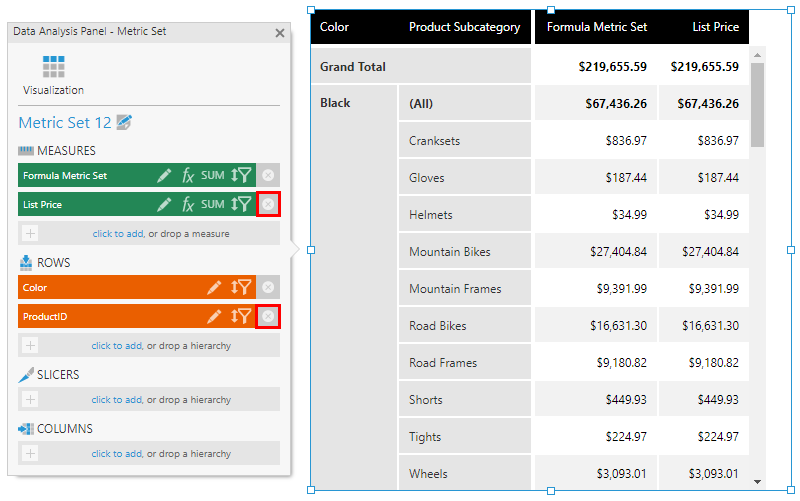
To make use of this ability, select a measure with multiple hierarchies. For example, this table lists products grouped by Color:
While editing a view such as a dashboard displaying this metric set, choose Data Visualization in the toolbar and then Formula Visualization to open the formula bar.
After entering a function such as AVG or SUM and the input values, type a comma, then click a hierarchy value in a visualization or type in the hierarchy as the second, alignment argument, before the closing parenthesis:
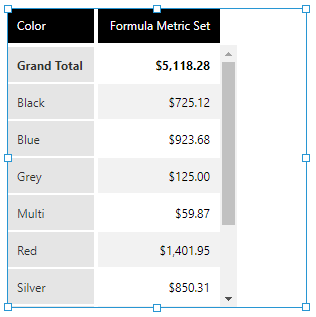
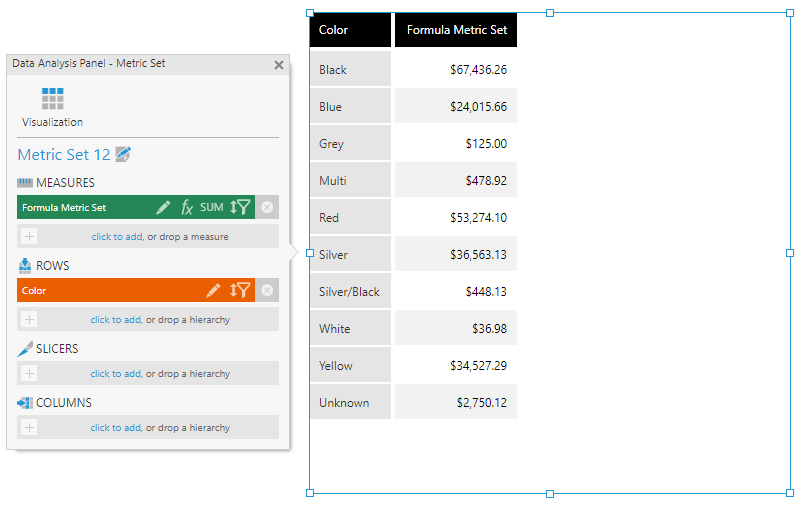
In our example, we are calculating the average list price for each color. Click apply to create the new formula metric set and visualization.
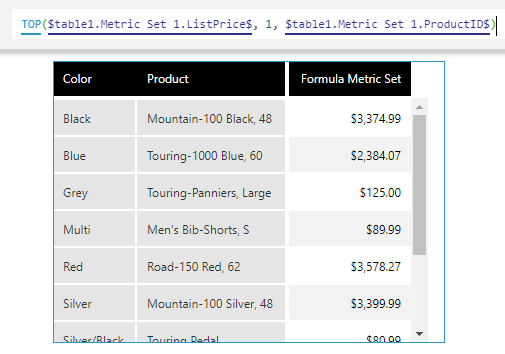
Another helpful function is the TOP or maximum subset function, which we can use with an alignment argument to provide the top (1) product for each color. Other subset functions can be used the same way, such as BOTTOM, FIRST and LAST.
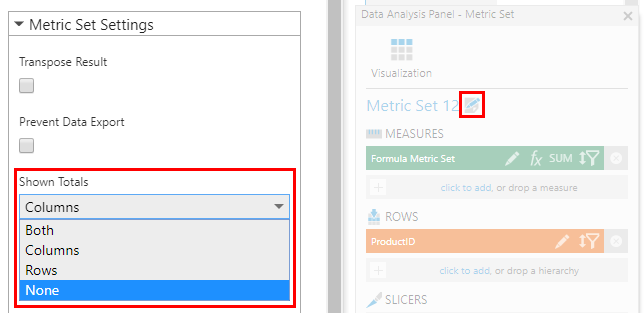
If totals are included that you don't want, you can disable them the same way as for any metric set: click the metric set's edit button in the Data Analysis Panel, then set Shown Totals.
5. Subset functions
When used in formula visualizations, subset functions can be used to reduce the full set of data to a particular subset of its rows or columns. This isn't possible when just adding a new formula measure column to an existing metric set.
For example, the TOP function that we used above with an alignment argument can also be used to ask for the top 3 list price values:
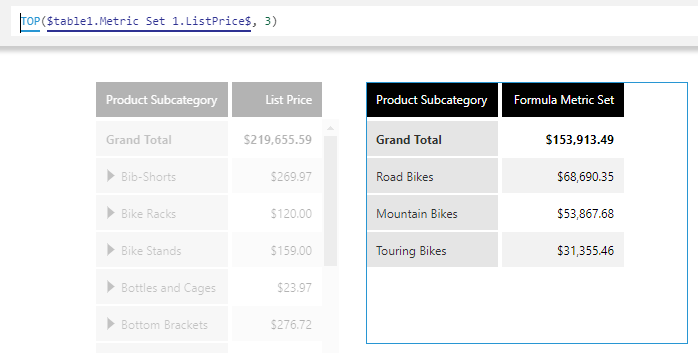
Because a formula visualization produces a completely new metric set and result, formulas can be used in this way to change the rows or columns that are displayed compared with the original metric set.
6. Filtering the formula metric set
The result of creating a formula visualization is a separate metric set. This means it's safe to delete the original visualization if you don't need it; otherwise, the two metric sets now request their data independently, including their sorting and filtering. If you have placed filters on your dashboard canvas or in a parameter bar, you will need to connect them to the new metric set for it to be affected.
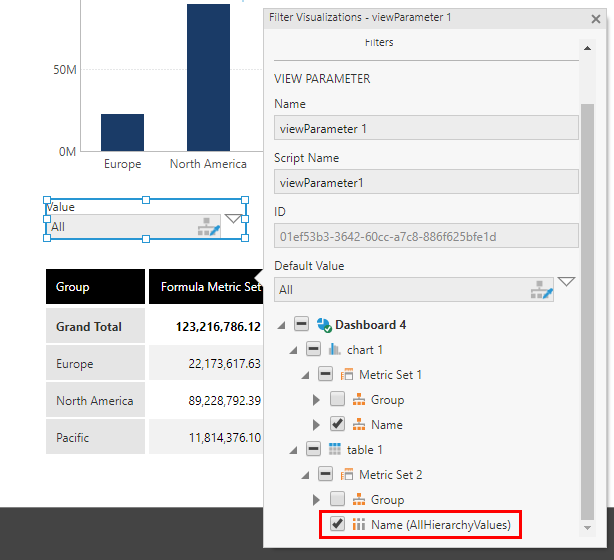
To connect an existing filter on the canvas to the formula visualization, click to select it while editing, then choose Connect Filters in the toolbar. When adding a new filter, the same Filter Visualizations popup appears automatically:
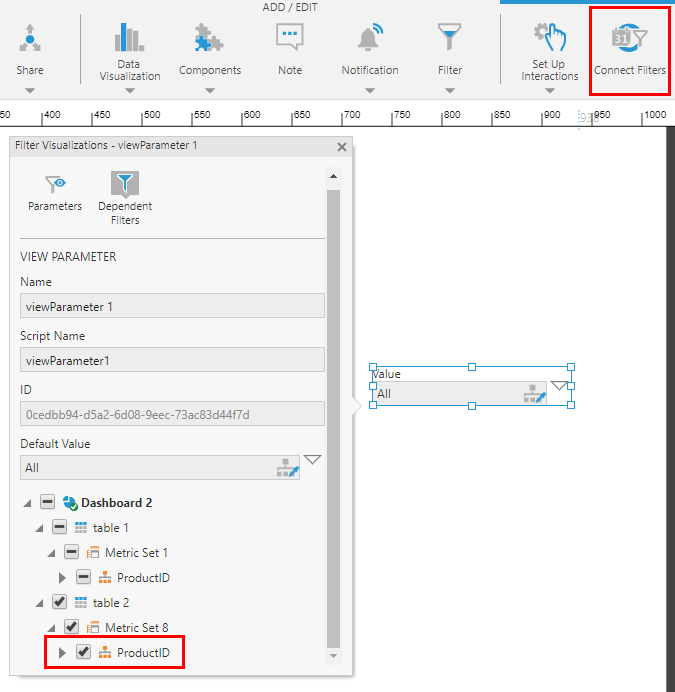
Check the box next to the hierarchy under the new visualization and its metric set.
Slicers in the original metric set can be filtered using the parameter that appears under the formula metric set:
There may be other parameters as well for other hierarchies in the original metric set, and you can connect your filters to these parameters. If a parameter is not available, you can add the hierarchy to the formula metric set as described in the following section, and then its parameter will be available.
If you are not using filter controls or your filters are in a parameters bar, you can also open the Parameters window and edit a view parameter to connect it to the formula metric set the same way as shown above.
7. Changing the formula metric set
When a formula visualization is created, its new metric set initially has certain measures or hierarchies based on the particular formula you entered. This determines how the data is grouped, as well as which information can be displayed within the new visualization.
If you want to change which hierarchies and measures are included, you can do so. This does not affect the original metric set, but only how this formula metric set groups and displays its result.
7.1. Removing elements
You can remove any element from the Data Analysis Panel that you don't want (including the measure containing the original formula).
When a hierarchy is removed, this affects how the result is grouped into rows or columns, and the remaining data is re-aggregated accordingly.
7.2. Adding elements
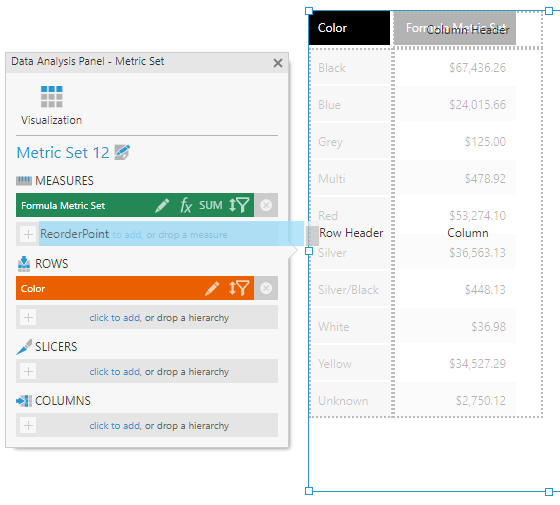
You can add any elements that are missing from the formula metric set, as long as they were already selected in the original metric set(s).
While you can't use the click to add links, you can drag the same elements from the Explore window that were added to the original metric set, and drop them onto the Data Analysis Panel of the new formula metric set. They must be in the same place they were added in the original metric set (e.g., under Rows, if originally added there).
If you need to add an element that is not already present in the original metric set, first add it to the original metric set. You will then be able to drag it onto the formula metric set, even if you created it earlier.
8. Advanced options
When using multiple metric sets in your formula, there are settings available that determine how the data is combined.
To access these settings, click the fx button of a measure in your formula metric set, and click any of the underlined formula functions (e.g., AVG). If you haven't used one of these functions yet, add a new formula measure to the formula metric set that uses one (you can remove it later).
In the formula dialog that appears, there are two options at the bottom:
- Alignment Behavior determines whether the rows of data in each metric set are matched up by their hierarchy's values (Hierarchical or Auto), or are combined arbitrarily by sequence (Positional).
- Enforce Hierarchy Cube Check is disabled by default. When un-checked and metric sets select data from different data cubes, hierarchies with the same unique name are assumed to be the same, allowing their rows of data to be matched up. If hierarchies should not be considered the same based only on their names for the data cubes you are using, you can check this option.
9. Notes
Formula visualizations have some limitations compared with the original metric sets:
- Like other formulas, they can't be created based on a metric set in raw data mode. Remove the <Row Number> element from Rows in the metric set's Data Analysis Panel before creating a formula visualization.
- Period over period measures can't be added to a formula metric set. They can instead be added to the original metric before creating the formula visualization.
- Formula metric sets don't support expand and collapse functionality.
- The level of a dynamic hierarchy in a formula metric set should be set to the same level as in the original metric set.
10. See also
- Video: Formulas
- Adding formulas
- List of formula functions
- Automatic joins and hierarchies
- Metric set analysis tools
- View data with a chart and drill down
- Understanding the Data Model