Usage tracking
1. Overview
When users view a dashboard, report, or other view, some statistics are recorded in the application database. A Developer user with access to the application database can create a data cube to process these statistics into a more user-friendly format and ultimately display this information in charts, tables, or other visualizations.
The recorded statistics keep track of the view being accessed, the user who is accessing it, and the time and duration of viewing. Based on this data, it is possible to derive additional usage information such as:
- The number of times it's viewed
- The average time spent viewing
- Time of day usage patterns
2. Enabling tracking
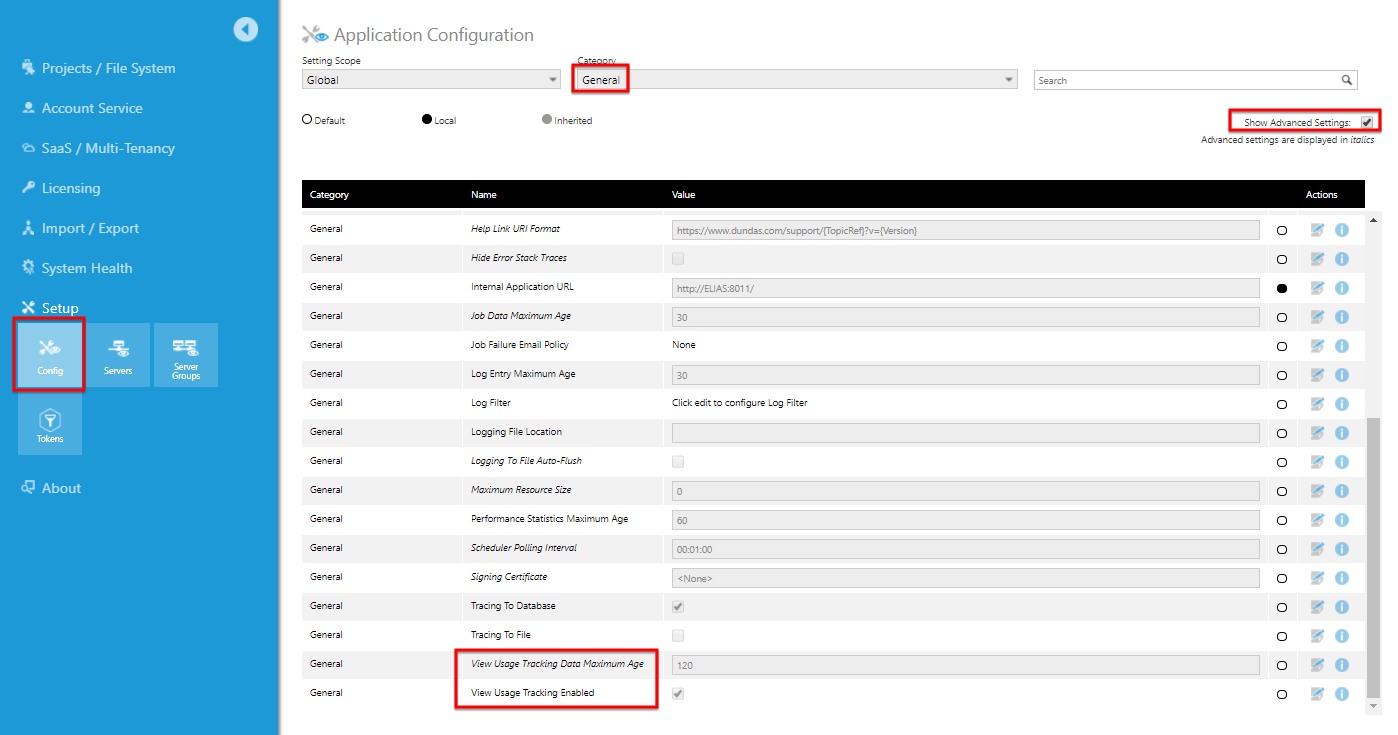
Tracking of view usage is enabled by default. To view or change the current setting, go to the configuration settings, click to show the advanced settings, and then scroll down to find:
- View Usage Tracking Data Maximum Age - Tracking data is stored for only the specified number of days
- View Usage Tracking Enabled - This is set to True by default
3. Application database
3.1. vUsageTracking
When tracking is enabled, usage statistics are recorded in the application database.
The basic connection details for your application database are displayed on the administration homepage. For example, if your application instance is named Instance1, the corresponding application database will likely contain this in its name.
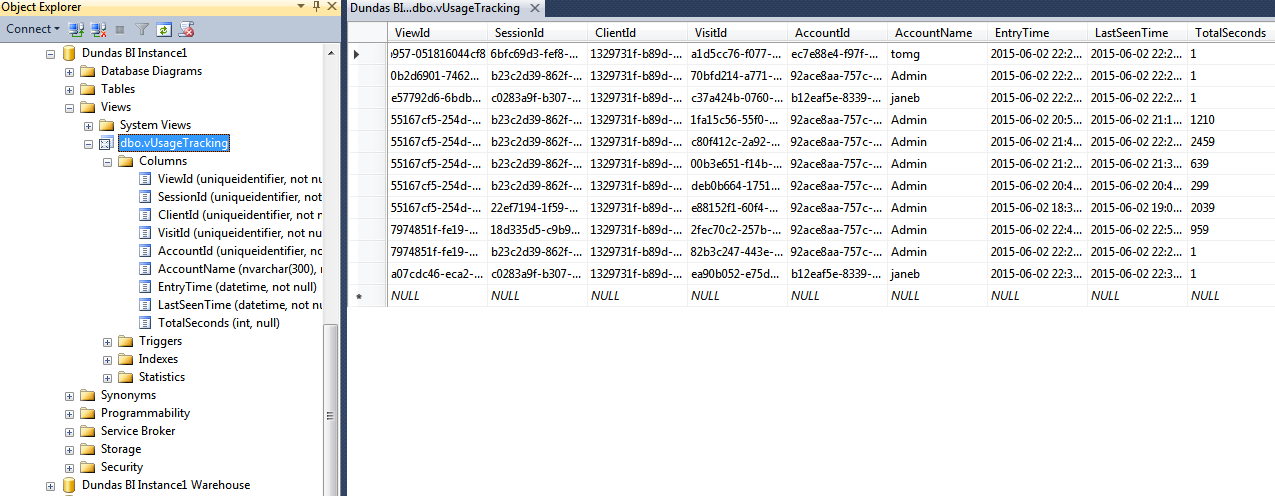
After creating a data connector to your application database on SQL Server or Postgres, the data connector's Views subfolder will contain a view named vUsageTracking with the following columns:
| Column | Description |
|---|---|
| ViewId | The ID of the dashboard, report, scorecard, or small multiple being viewed. |
| SessionId | The ID of the user's logon session. |
| ClientId | This ID identifies the user's web browser. |
| VisitId | A unique ID identifying this tracking event. |
| AccountId | The ID of the user (account) that is viewing. |
| AccountName | The username of the user (account) that is viewing. |
| EntryTime | The UTC date and time the viewing began. |
| LastSeenTime | The UTC date and time the viewing ended. |
| TotalSeconds | How long the file has been viewed so far (in seconds). |
3.2. FileSystemEntry table
The usage tracking database view gives you the ID of each dashboard, report, and other view file that is being accessed. In order to extract more user-friendly information, such as the name of each view, you need to also use the FileSystemEntry table in the application database.
Using the FileSystemEntry table, you can look up the names of files in the Explore window based on their IDs. Files such as dashboards, projects, data cubes, and metric sets can all be found in this table. You can determine the ID of any file in the Explore window or Admin File Explorer by right-clicking on the file and opening its properties dialog.
Below are some of the columns from the FileSystemEntry table:
| Column | Description |
|---|---|
| Id | The ID of a file such as a dashboard, report, data cube, or metric set. |
| Name | The name of the file (e.g., dashboard name, report name, data connector name). |
| ProjectId | The ID of the project containing this file. You can look up the ID in this same table in order to get the name of the project. |
4. Examples
4.1. Build a data cube to show usage information
The following example shows you how to create a data cube that combines the vUsageTracking data with the FileSystemEntry table in order to show more user-friendly usage information.
Here are the detailed steps:
- Create a new data connector using the SQL Server provider to connect to the application database.
- Create a new data cube using the Blank option.
- Go to the Explore window, expand your data connector, and then expand its Views folder.
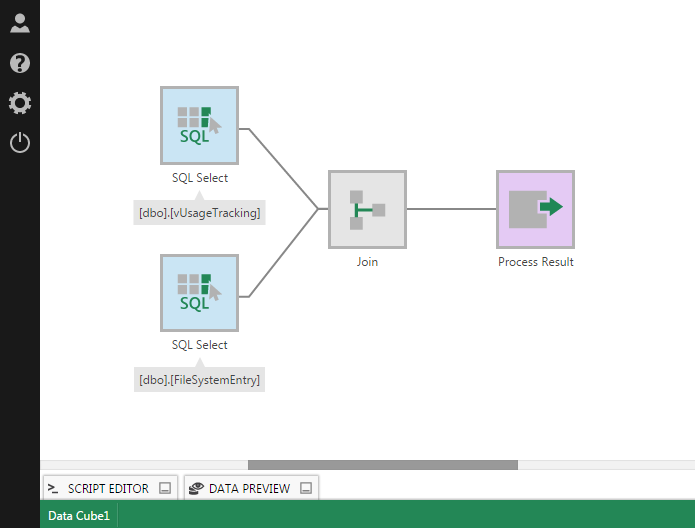
- Drag vUsageTracking to the data cube canvas. It will appear as a SQL Select transform that is connected to a Process Result transform.
- Select the connection link between the two transforms, click Insert Common in the toolbar, and then select to insert a Join transform between the two transforms.
- Drag the FileSystemEntry table from the Explore window to the canvas. It will appear as a 2nd SQL Select transform.
- Click and drag to connect the 2nd SQL Select transform to the join transform, and then double click the Join transform to configure it.
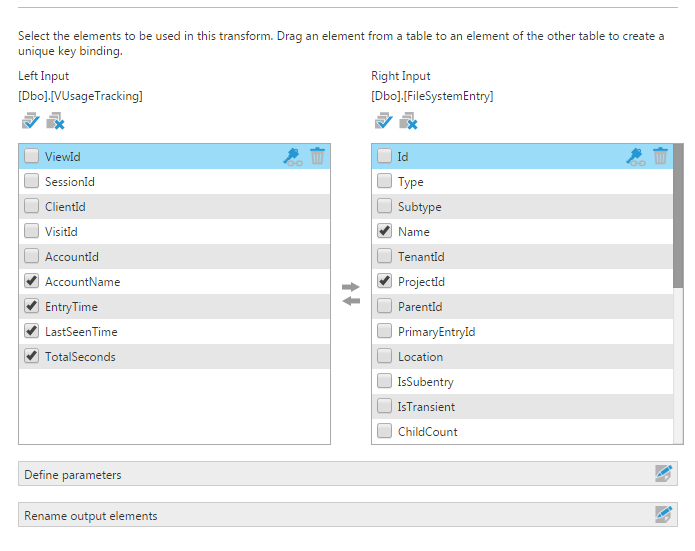
- In the configuration dialog, drag the ViewId element on the left and drop onto the FileSystemEntry table's Id element on the right.
- In the left table, select or uncheck each checkbox to include these columns:
- AccountName
- EntryTime
- LastSeenTime
- TotalSeconds
- In the right table, select these columns:
- Name
- ProjectId
The next few steps show you how to replace the ProjectId column with the project name:
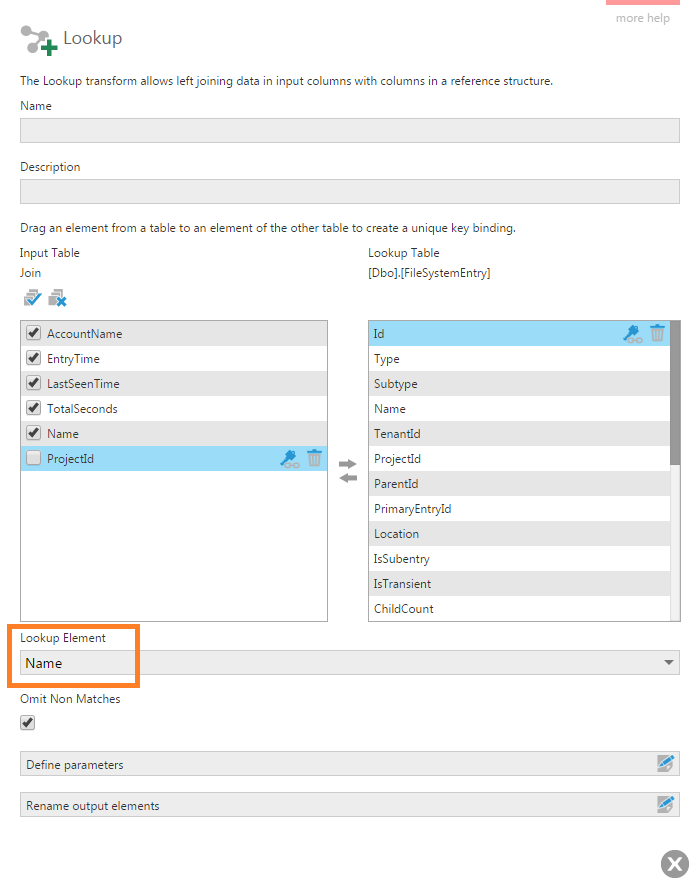
- Select the last connection link, go to the toolbar, click Insert Common, and then select Lookup. This will insert a Lookup transform just before the Process Result.
- Go to the Explore window and drag another FileSystemEntry table to the canvas. It will appear as a SQL Select transform. Click and drag to connect this transform to the Lookup transform.
- Double-click the Lookup transform to configure it: drag the ProjectId element on the left and drop it onto the Id on the right. Uncheck the ProjectId element in the left table to exclude it from the output, and set the Lookup Element dropdown to Name to output the project name instead. Click to rename the Output elements and you'll see two Name columns: rename the first one to ViewName, and the second one to ProjectName.
After submitting the configuration dialog, you can click to open the Data Preview to view the resulting data:
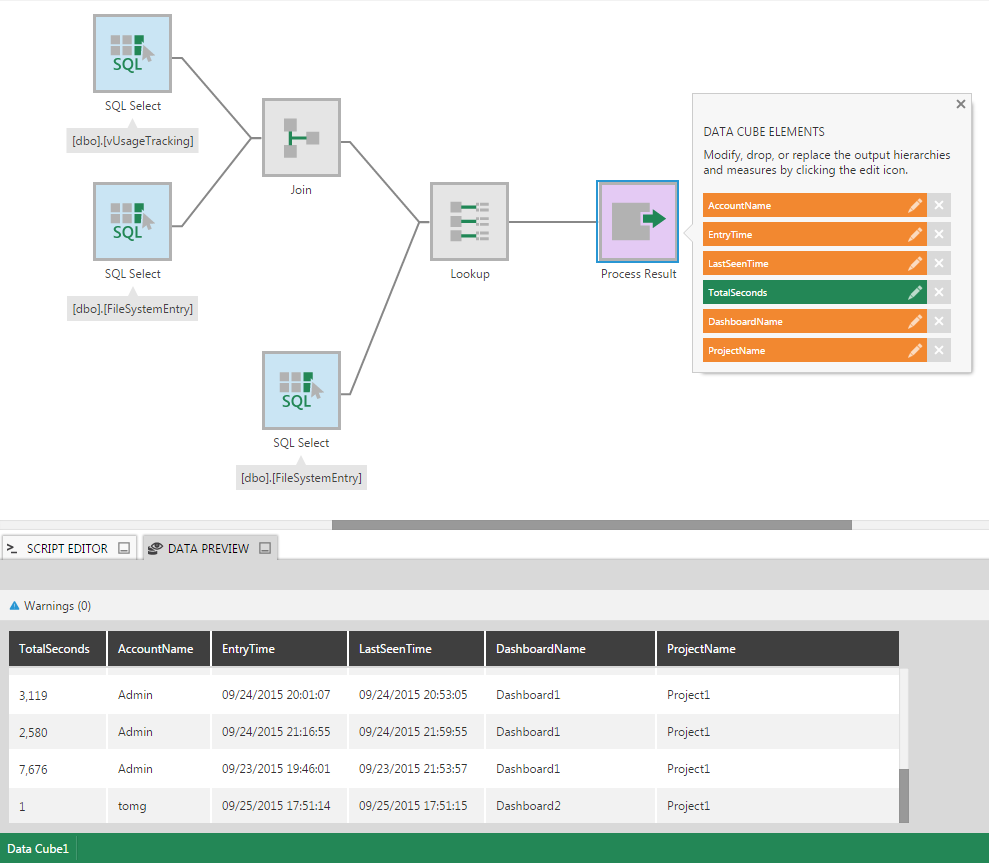
You can now easily display this information in a metric set or dashboard.
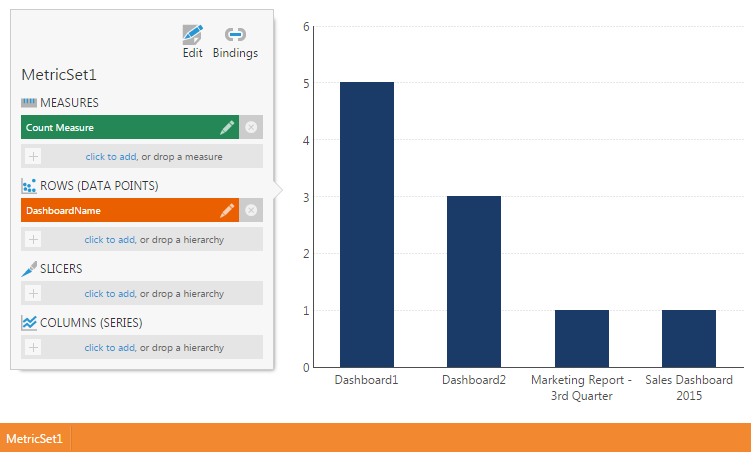
4.2. Show how many times each view file has been viewed
Using the data cube created previously, it is easy to set up a chart to display the number of views per dashboard:
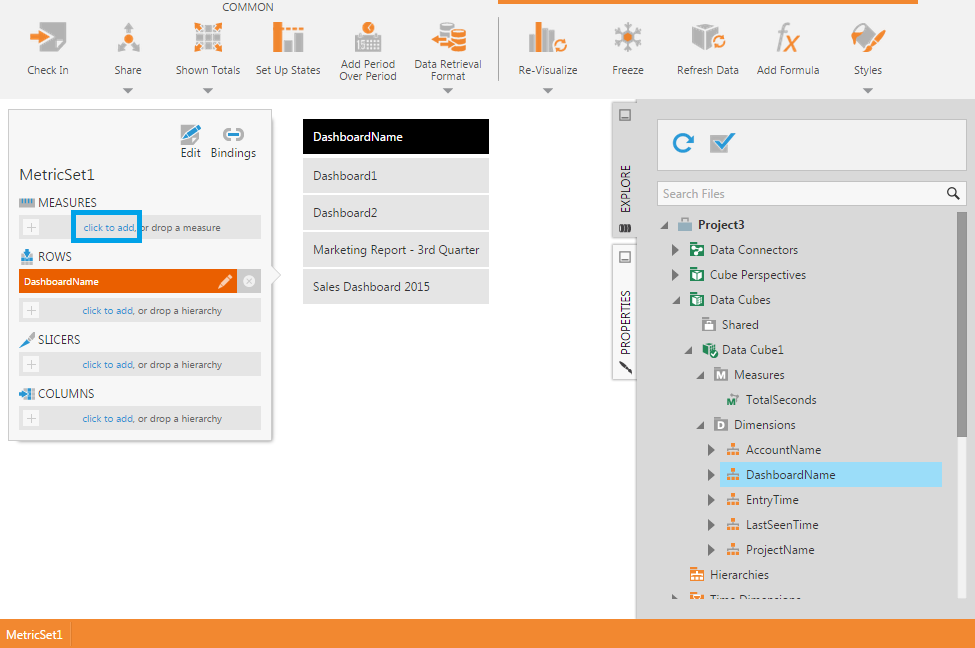
- Create a new metric set from the main menu.
- Expand the data cube in the Explore window and drag the ViewName dimension to the canvas.
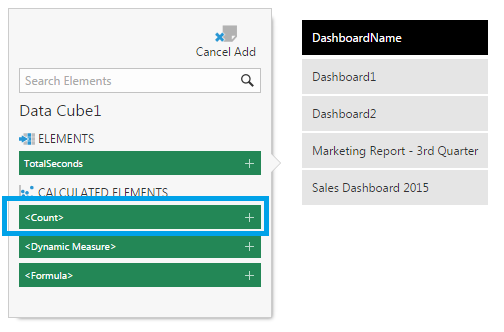
- In the Data Analysis Panel, click to add under Measures, and choose <Count> from the list of elements, located under Calculated Elements. This adds a count measure to the metric set.
- You can click in the toolbar to Re-visualize the metric set as a Bar Chart if it wasn't visualized this way automatically.