
Normal Distribution
The Normal Distribution function calculates the standard normal distribution for an input data series.
Specifically, the function computes the relative likelihood that a continuous random variable would equal the input value if the series had a symmetrical "bell-curved" distribution.
The Normal Distribution Group function can be optionally used to calculate the standard normal distribution for each input data series grouped by the specified hierarchies.
1. Syntax
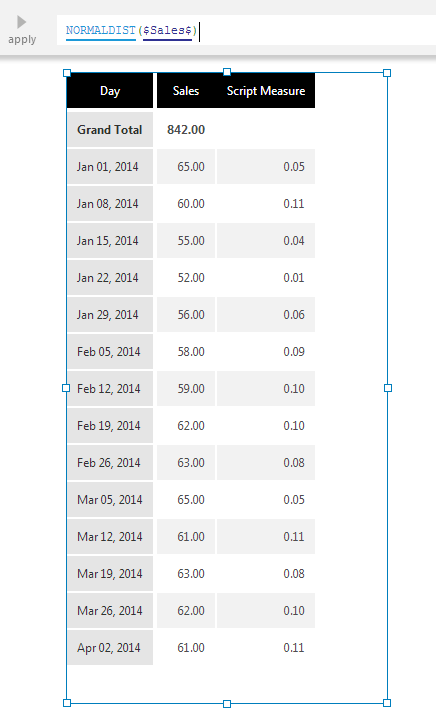
Normal Distribution:
NORMALDIST(d0,Alignments...)
Normal Distribution Group:
NORMALDISTGROUP(d0,Alignments...)
2. Input
The Normal Distribution functions require the following input series:
- d0 - Input data values - The set of data values for which the Normal Distribution is calculated.
3. Parameters
The Normal Distribution functions accept the following parameters:
- Alignments... (One or More, Optional) – Hierarchy placeholders to be used as the alignment axis.
- For NORMALDIST, specifying a hierarchy calculates standard normal distribution for the corresponding input values separately each time they occur: e.g., NORMALDIST($Measure$, $Month$) can calculate results based on monthly values grouped by another hierarchy such as Country.
- For NORMALDISTGROUP, specify the hierarchies by which to group the input values and calculate the standard normal distribution within each group: e.g., NORMALDISTGROUP($Measure$, $Country$) will calculate results separately for the values within each country.
4. Output
The Normal Distribution functions generate the following outputs:
- Normal Distribution - The Normal Distribution result set(s).