Create a cube perspective
1. Overview
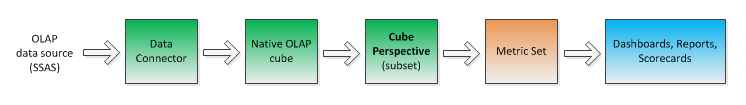
When you create a data connector using an OLAP provider such as SQL Server Analysis Services, you gain access to native OLAP cubes and their measures and dimensions. However, you may not want to expose all of these elements (e.g., entire cubes) to other users.
As a Dundas BI Developer user, you can create a cube perspective which defines a subset of the available measures and dimensions from a native OLAP cube. You then give Power users access to this cube perspective instead of the full (native) cube so they can build metric sets and dashboards.
Related video: Understanding Cube Perspectives
2. Creating a cube perspective
2.1. Connect to an OLAP data source
Before creating a cube perspective, you need to connect to an OLAP data source which gives you access to a native OLAP cube. See the first part of Connect to OLAP data and apply a formula for the steps.
2.2. Create a new perspective
If available, you can use the main menu to create a new cube perspective under Data. (This option may not appear if there are no existing cube perspectives.)
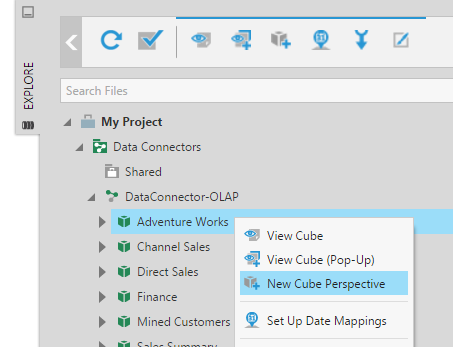
You can also create a new cube perspective from the Explore window when you have another file open such as a dashboard or metric set:
- Expand your OLAP data connector and right-click on a native OLAP cube (e.g., AdventureWorks).
- From the context menu, select New Cube Perspective.
- This opens the Cube Perspective editor with the selected OLAP cube already loaded (so you can skip the next step).
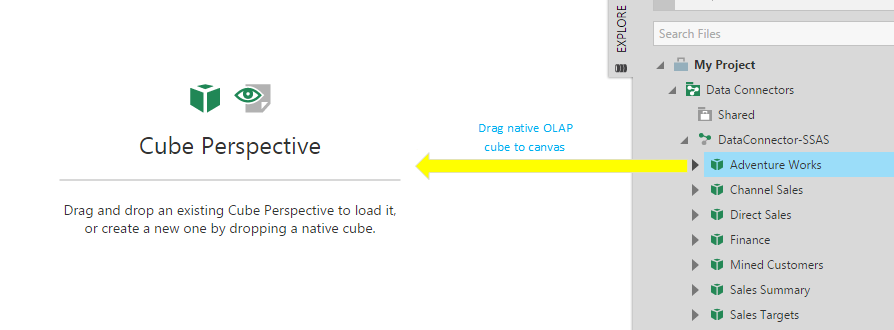
2.3. Drag and drop a native OLAP cube
If the new cube perspective is blank because you didn't already choose a cube, go to the Explore window, find your OLAP data connector and expand it to see its available cubes.
Drag-and-drop a cube from the Explore window to the canvas.
2.4. Select measures and dimensions
A Edit Cube Perspective panel on the left will list the measures, dimensions, and hierarchies of the native cube, often in folders that you can click to expand.
Use the checkboxes to select and de-select the elements of the native cube that you want included in this cube perspective.
The Data Analysis Panel and table visualization in the middle part of the screen let you preview measures and dimensions while selecting them. (This is for your convenience and is not saved.) You can drag measures or hierarchies onto the Data Analysis Panel or click to add them to see your data.
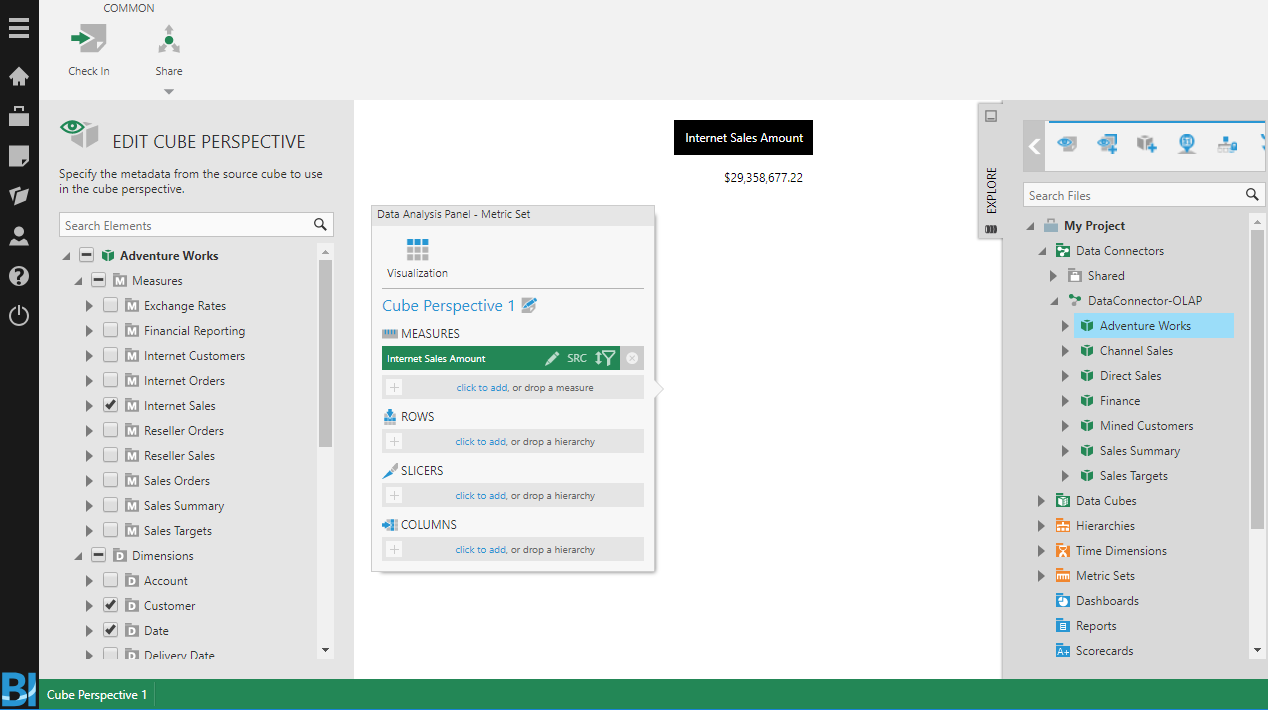
2.5. Check in your changes
Once you are done with the checkbox selections, go to the toolbar and click Check In to let others see and use the cube perspective.
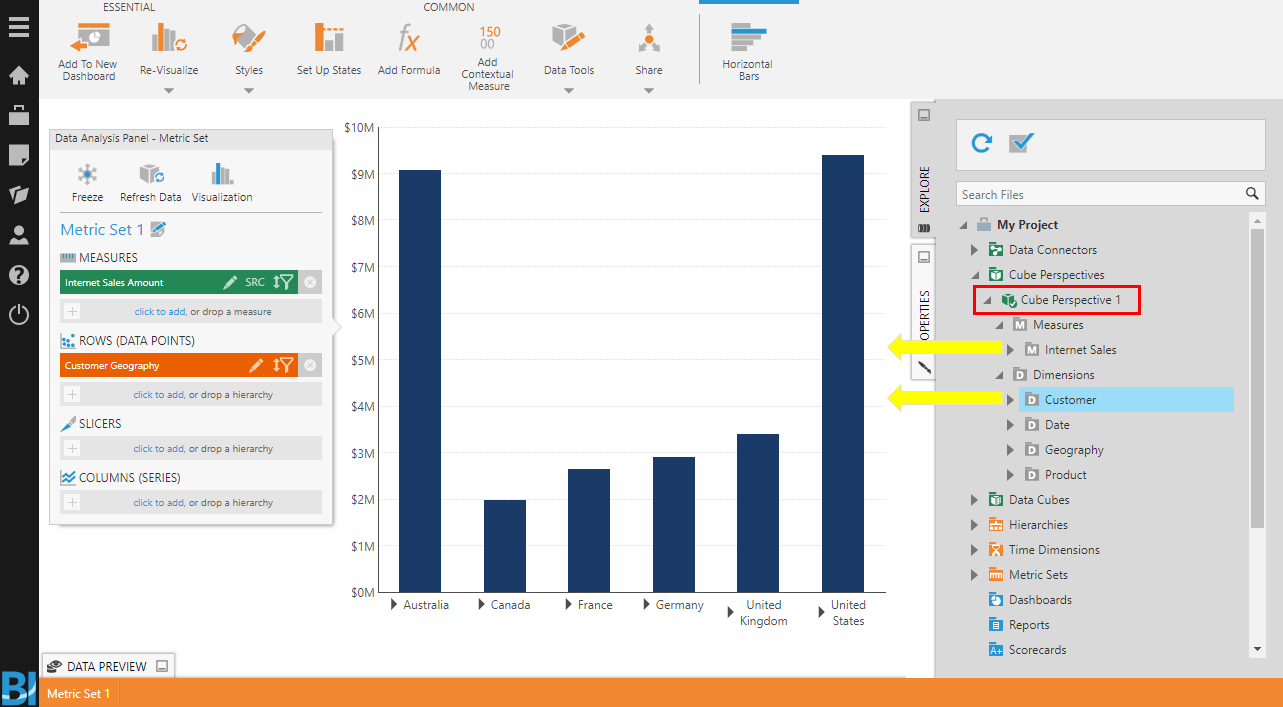
3. Using a cube perspective
Cube perspectives can be used in the same way as native cubes. For example, simply drag measures and hierarchies from a cube perspective in the Explore window to the canvas of a metric set or dashboard to display a table or chart.