 Dundas BI Version 2.6 adds even more ways to better prep and visualize your data - making it even easier to get to your business insights even faster.
Dundas BI is constantly being enhanced to help you access, interact and visualize your data so you can see what’s going on in your business. Soon after the release of some great, innovative features in Version 2.5, Version 2.6 is now here.
Richer Data Prep, Better Analysis
- New Data Connections – Easily connect to SharePoint Lists and Excel services inside Office 365
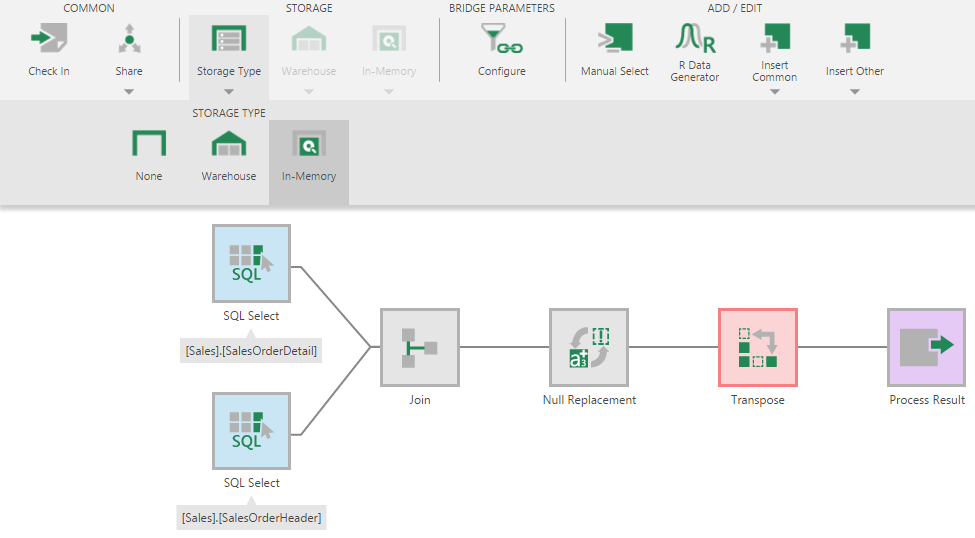
- More Data Transformations – Manipulate your data to the structure and logic you need with the new Transpose and Null Replacement transforms
- Faster Data Model Setup – Insert data transforms into your model anywhere in the flow and build your model as you go
More Control, Intuitive Experience
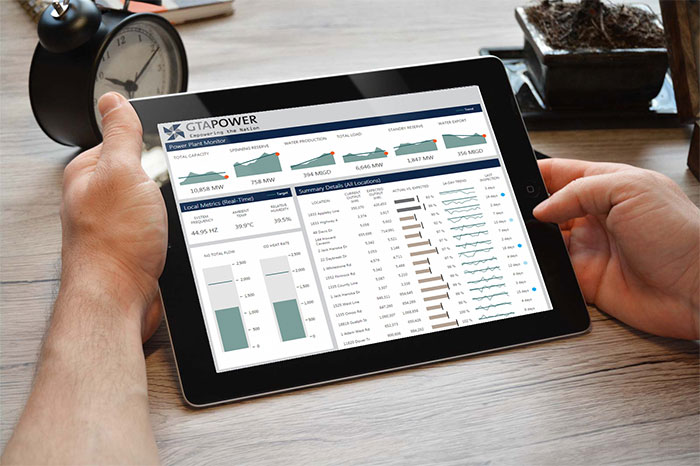
- Pinch-to-Zoom on Scale Mode - Use intuitive touch gestures to better view your data on different devices starting from a perfect auto scale that fits to your screen size onto zooming into specific details
- Navigation to Other URLs – Better integrate with other web applications with navigation interactions designed to keep the same data context as selected by the user
- Quick Filters Setup – One click to bind your filter to all applicable visualizations on your views
Smarter Visuals, More Customizations
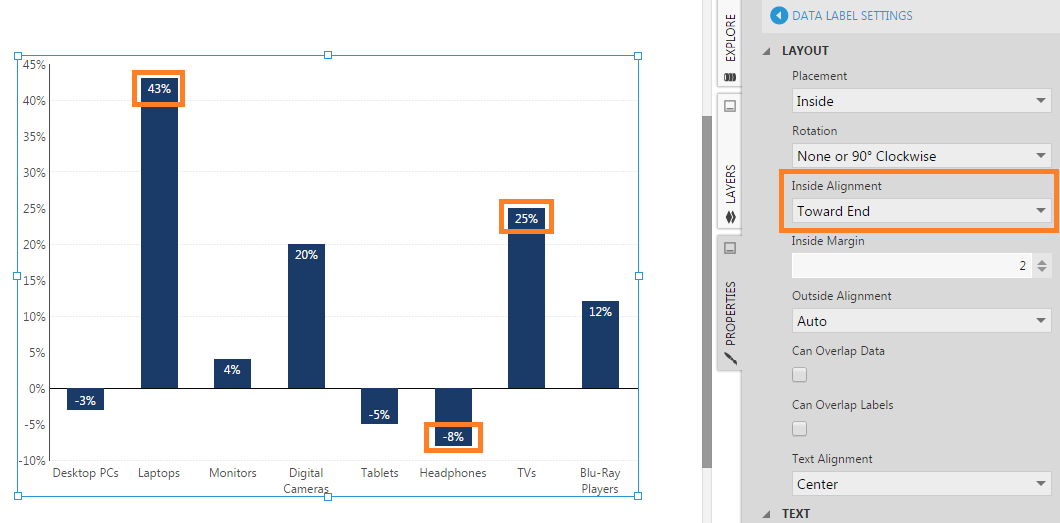
- New Labels Positioning – Align labels inside bars towards the start or end of each bar
- Always Show All Labels – Allow text placed outside of data points to overlap with data points or other labels so it can still be visualized
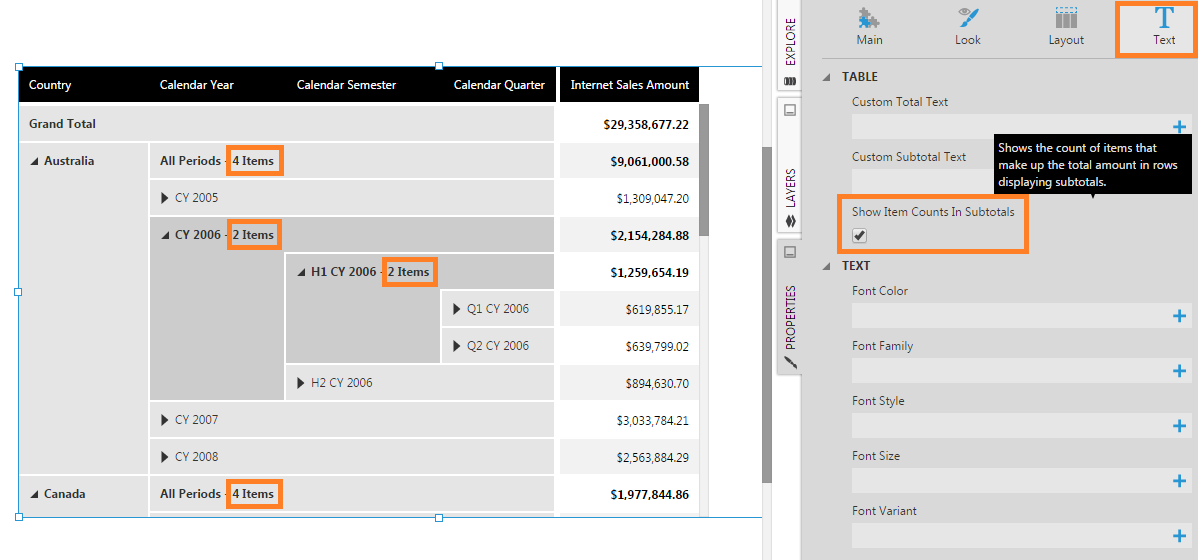
- Subtotals Counts - Show item counts for subtotals categories as a quick summary of magnitude within a table visualization
- HTML Tags within Data Labels - Use HTML tags to style data labels and match any requested design
Better Performance, Faster Insights
- In-Memory Performance Enhancements – Reduced memory usage by up to 20%, faster data reading from memory by up to 20% and reduction in storage time to memory by up to 70%
- Faster Embedded Views Load – New view containers for embedding scorecards, reports or dashboards within other dashboards reduces load time by up to 50%
- Better Search - Improved search time for OLAP cubes hierarchy members in filter controls by up to 50%, ability to search for user defined tags to quickly find objects and more search options for easier system administration
Follow Us
Support