R Language Analysis
The R Language Analysis transform lets you write scripts using the R programming language to perform statistical and predictive analysis on data. This is similar to the R Data Generator transform except that it operates on input data from a preceding transform instead of generating its own output.
R is both a programming language and an environment for statistical computing and graphics. To learn more about the R language, see The R Project for Statistical Computing.
1. Setup
Before you can use the R Language Analysis transform in Dundas BI, the R programming environment must be installed on a server.
See Install and configure R for more details.
2. Input
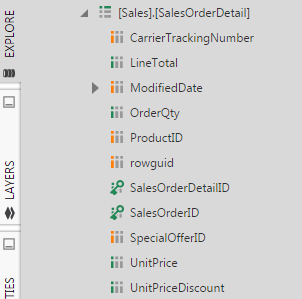
The R Language Analysis transform requires one or more input transforms, each of which may produce multiple columns of data.
For example, the input could be a SQL Select transform that reads data from the AdventureWorks 2012 table [Sales].[SalesOrderDetail].
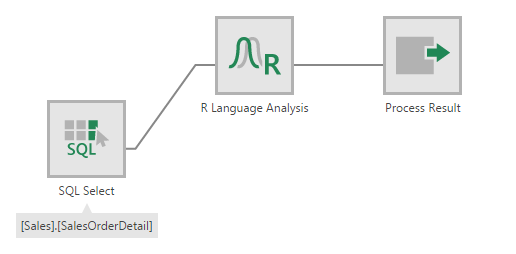
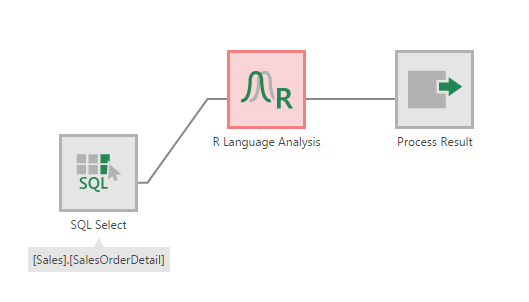
3. Add the transform
To add this transform to an existing data cube process, first select the connection link between two connected transforms.
Go to the toolbar, click Insert Other, and then select R Language Analysis.
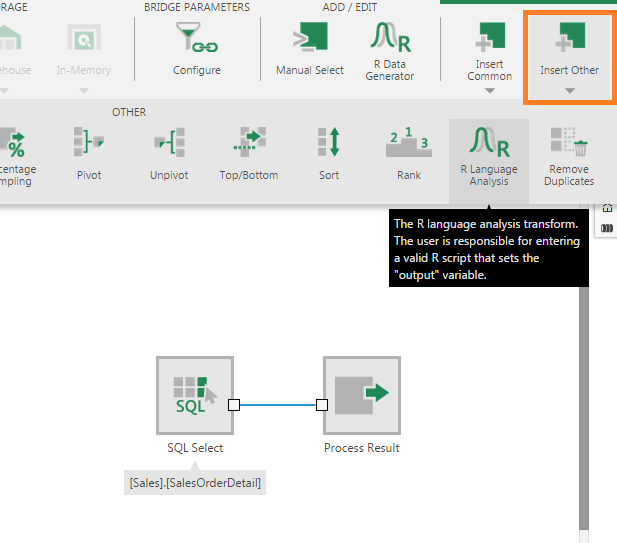
The R Language Analysis transform is inserted between the two transforms and appears highlighted because it needs further configuration.
4. Configure the transform
Double-click the R Language Analysis transform or select the Configure option from its right-click menu.
In the configuration dialog for the transform, the objective is to decide which input column(s) you want to analyze or apply processing to, and then enter an R script that performs this analysis or processing on the input data.
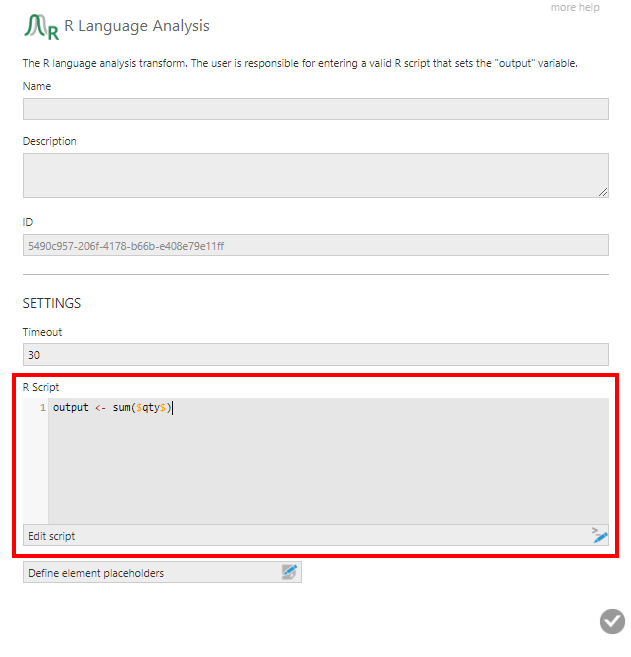
For example, suppose you want to calculate the total sum of the OrderQty column from the input transform, and send this sum as the output.
To begin, click Define element placeholders in the configuration dialog. Click Add placeholder. In the Identifier box, enter a variable name (e.g., qty) for the input column which you will use in the R script. Use the dropdown to select the corresponding input column (e.g., OrderQty).
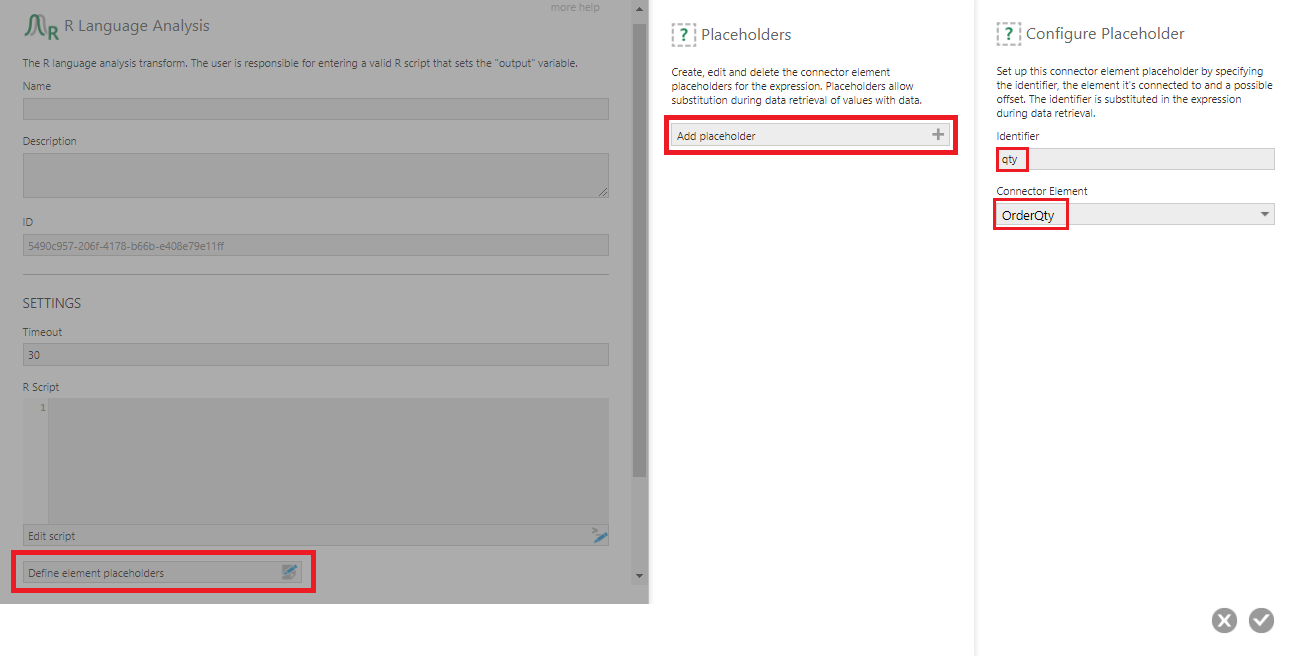
You can now write an R script that references the qty variable by enclosing it between dollar sign characters. For example:
output <- sum($qty$)
This script calculates the sum of the OrderQty input column and assigns the result to the output variable.
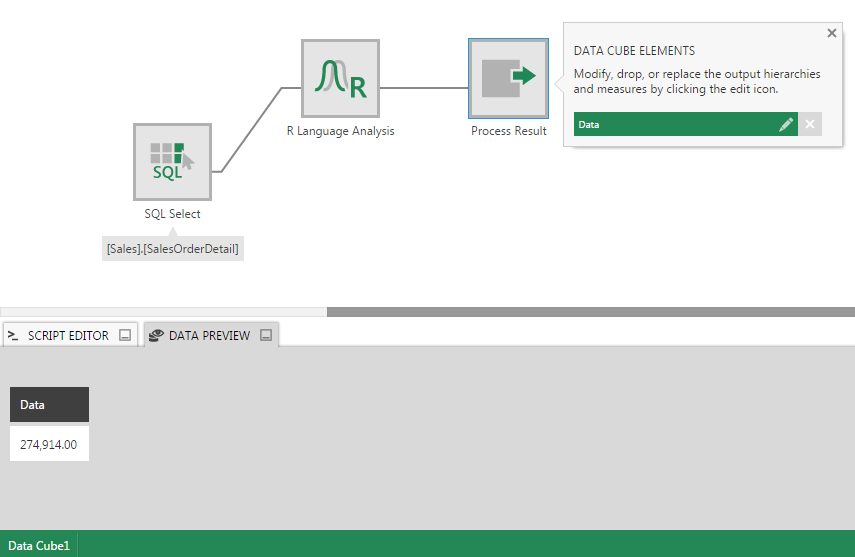
5. Output
The output of the R Language Analysis transform depends on the R script it is configured with. It can be a single value, a column of values, or multiple columns.
In the case of the script that calculates the sum of the OrderQty column, you can see an output column named 'Data' by selecting the Process Result transform and then clicking on Data Preview.
6. Example R scripts
6.1. Concatenate text columns
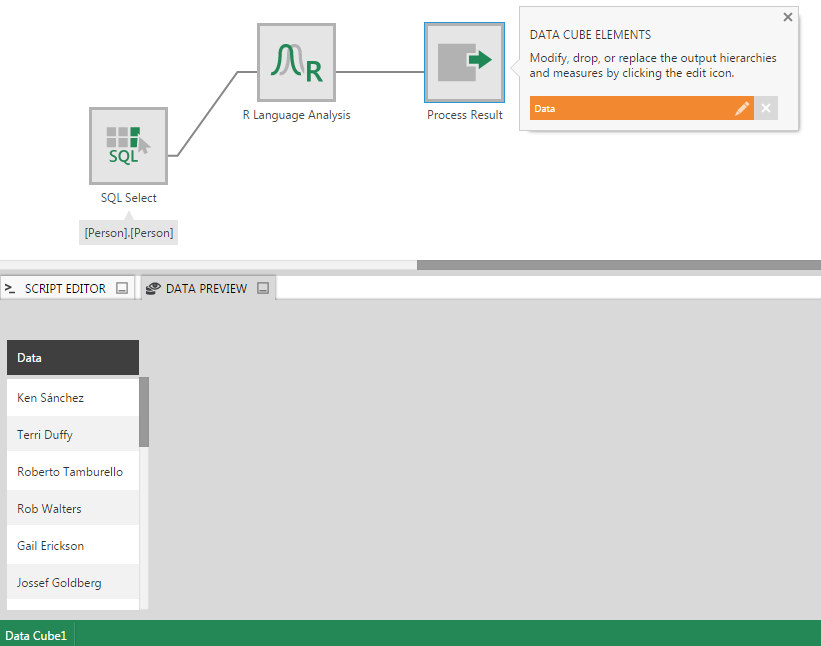
For this example, use the [Person].[Person] table from AdventureWorks 2012 as input to the R Language Analysis transform.
Define element placeholders for the FirstName and LastName columns. Then enter the following R script to concatenate the two text columns into a single output column:
output <- paste($FirstName$, $LastName$, sep=" ")
Here's the resulting output:
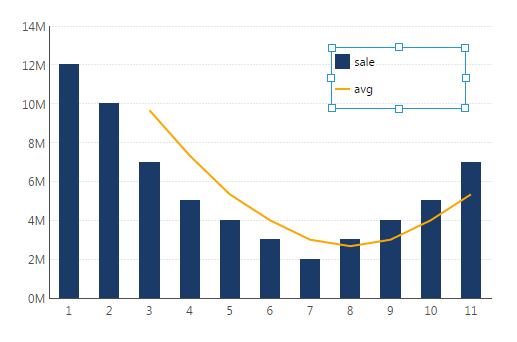
6.2. Moving average
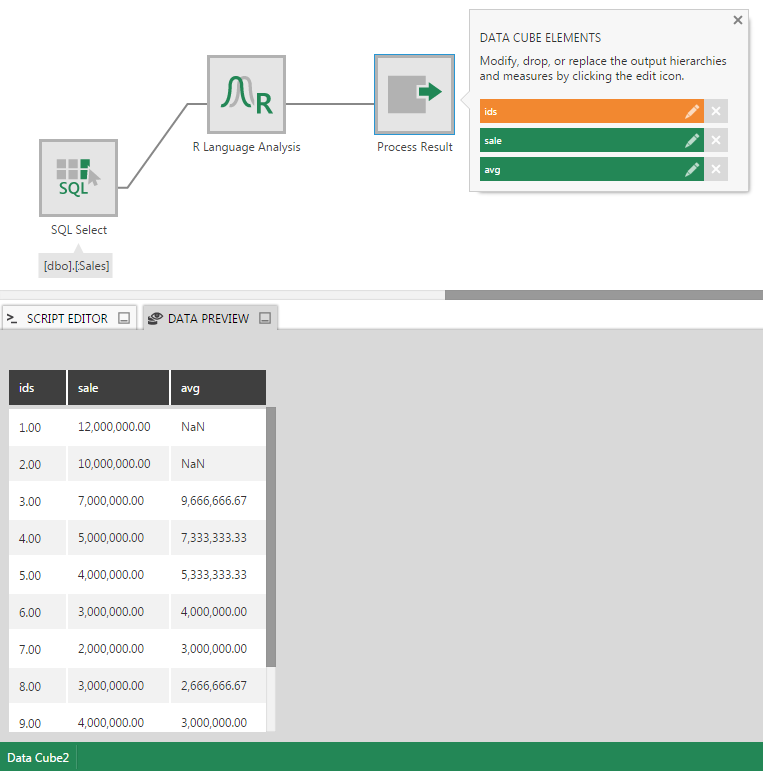
Suppose you have a Sales table with a Sales column containing figures for 11 months.
Use this as input to a R Language Analysis transform, define a placeholder for the Sales column, and then enter the following R script:
movavg <- function(x,n=3){filter(x,rep(1/n,n), sides=1)}
sale <- $Sales$
avg <- movavg($Sales$)
ids <- 1:11
output <- data.frame(ids, sale, avg)
Here's the resulting Data Preview showing the output:
And the corresponding visualization on a dashboard: