The journey of implementing a business intelligence (BI) project goes through many steps, such as selecting the right metrics, creating the right design for the dashboards, deciding how best to deliver those results to the users, etc. However, the success of a BI system depends on its adoption by end users; more specifically, users who want to quickly navigate to and look at dashboards for analysis purposes. This is where it becomes crucial to provide users with options to navigate to the content they want in a manner that they are comfortable with.
Dundas BI offers multiple ways of customizing this experience through different navigation methods that can be setup as per the user’s preferences as detailed in this post. However, in cases where the available methods are not enough to meet your needs, or you need methods to simplify the user accessibility even further, you can always customize the experience by accessing the content via Dundas BI’s APIs and creating a customized navigation for your users.
In the past, I wrote about one such method of using the APIs to build a custom user interface. The sample discussed in that post showcases how to retrieve different content objects within the system by making a REST API call using the Python Data Generator. However, you are not restricted to this method only. You can also access content using the JavaScript API by querying the Dundas BI File System to get a list of projects and dashboards. This allows you to create a self-referential navigation system; this method of querying also ensures that user-based security is preserved. I’ll discuss this approach in more detail in this blog.
Implementation
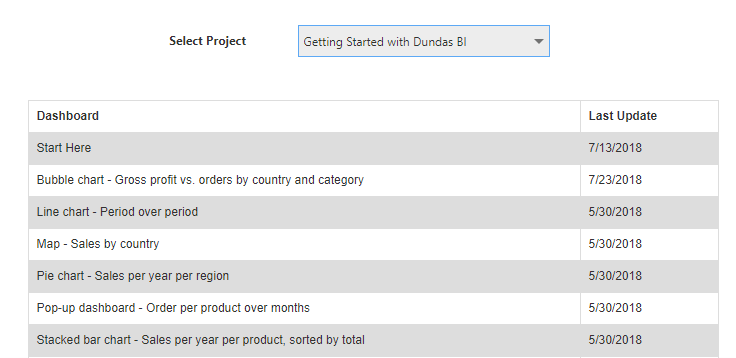
In order to implement this, we’re going to use a dropdown list and will populate it with a list of projects in the system and display them in a table built using the HTML Label control. Changing the selection on the dropdown to a different project changes the display in the table.
First, add an HTML Label onto your dashboard and set the HTML Label Text to the following:
<style>
table {
font-family: arial, sans-serif;
border-collapse: collapse;
width: 100%;
cursor: pointer;
}
td, th {
border: 1px solid #dddddd;
text-align: left;
padding: 8px;
}
tr:nth-child(even) {
background-color: #dddddd;
}
</style>
<div>Select a project.</div>
This HTML Label is used to build the table that displays the dashboard list. Please change the dimensions accordingly.
Next, add a Dropdown list from the components list and change the script name to 'dropDownListProjects'.
In the Ready Action of the dashboard, add the following script that loads all the projects within your system into the dropdown list:
var projectService = dundas.context.getService("ProjectService");
var def = projectService.getAllProjects();
def.done(function(projects){
if(projects && projects.length > 0) {
var list = [];
var item = new dundas.controls.DropDownListItem();
item.caption = "Select a project";
list.push(item);
for (i=0;i<projects.length;i++)
{
var item = new dundas.controls.DropDownListItem();
item.caption = projects[i].friendlyName;
item.value = projects[i].id;
list.push(item);
debugger;
}
dropDownListProjects.items = list;
}
});
def.fail(function(){
alert("Failed to load projects");
});
In the Selection Changed Action of the Dropdown List, add the following script that queries the Dundas BI File System and generates a list of all the dashboards within the project selected in the dropdown. The dashboards are displayed in a table built in the HTML Label.
Note that there is also a navigation component at the end that takes the user to the dashboard on click. Change the ‘your_instance’ in the on-click event to point to your Dundas BI dashboard instance.
// Get selected project from the drop-down list
var selectedItems = dropDownListProjects.items.filter(function (item) { return item.isSelected; });
if (selectedItems[0].caption == "Select a project")
{
return;
}
// Get references to necessary Dundas BI services
var service = dundas.context.getService("FileSystemService");
var viewService = dundas.context.getService("ViewService");
// Create query
var def = service.queryEntries({
entryId: selectedItems[0].value,
pageNumber:0,
pageSize:150,
orderBy: [
new dundas.filesystem.OrderBy({
"fileSystemQueryField":dundas.filesystem.FileSystemQueryField.LOCATION,
"sortDirection": dundas.SortDirection.ASCENDING
}),
new dundas.filesystem.OrderBy({
"fileSystemQueryField":dundas.filesystem.FileSystemQueryField.NAME,
"sortDirection": dundas.SortDirection.ASCENDING
}),
],
filter: [
new dundas.filesystem.QueryFilterRule({
"field": dundas.filesystem.FileSystemQueryField.OBJECT_TYPE,
"operator": dundas.QueryFilterOperator.EQUALS,
"value": dundas.ObjectType.DASHBOARD
})],
"queryOptions": dundas.filesystem.FileSystemQueryOptions.RECURSIVE_QUERY
});
// Deferred functions for callback of filesystem query
def.done(function(files)
{
if (files != null && files.length > 0) {
displayFiles(files);
}
});
def.fail(function() {
alert('Unable to query dashboards');
});
// Used to bind data to the datagrid. Change the 'your_instance' in the on-click event to point to your Dundas BI dashboard instance
function displayFiles(files)
{
var htmlContent = '<table><tr><th>Dashboard</th><th>Last Update</th></tr>';
for (i=0;i<files.length;i++)
{
var row = "<tr onclick=document.location=\"http://your_instance/Dashboard/{2}?e=true&vo=viewonly\"><td>{0}</td><td>{1}</td></tr>".format(files[i].friendlyName, files[i].lastModifiedTime.toLocaleDateString(), files[i].id);
htmlContent = htmlContent + row;
}
htmlContent = htmlContent + '</table>';
debugger;
$("#projectContainer").html(htmlContent);
}
Conclusion
As you can see, we can use the File System service to fetch content within Dundas BI and display it in a more customized manner for users. The case discussed here is a simple use case and the main takeaway is seeing how to get content created within the system using JavaScript. We can always make the display of content in a different way than the one shown here (i.e., display more fields, add more filters to restrict the display, etc.)
Note that the REST API approach using the Python Data Generator provides a method to fetch data from a data cube and display it using Dundas BI’s visualizations, such as a table, and does allow more options for which to interact with content such as sorting, filtering, etc., but does require knowledge of the Python programming language in order to understand and implement it, whereas the approach shown here can be done purely using JavaScript.
Follow Us
Support