We've had some time to think of our (and your) favorite videos, blogs, eBooks, and busines...

We've had some time to think of our (and your) favorite videos, blogs, eBooks, and busines...
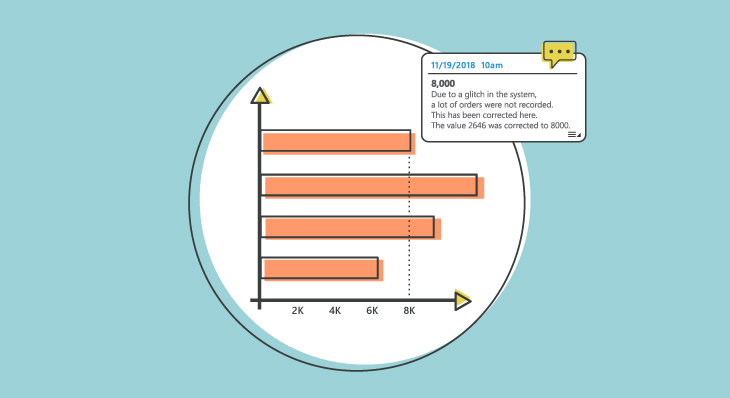
One of the more common challenges a lot of organizations encounter, is around being able t...
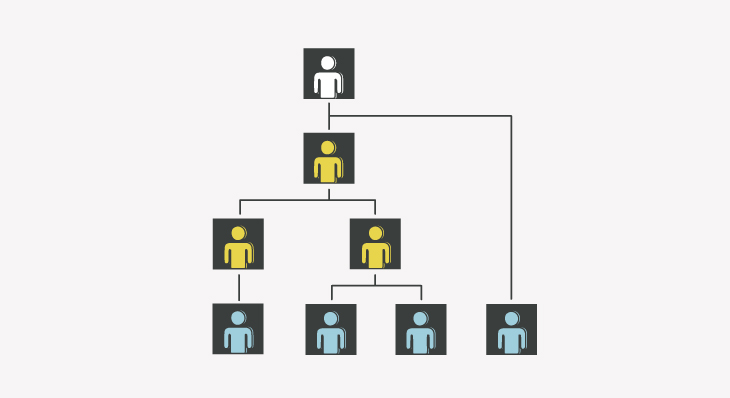
To get away from side discussions occurring in 3rd party tools, the conversations need to ...
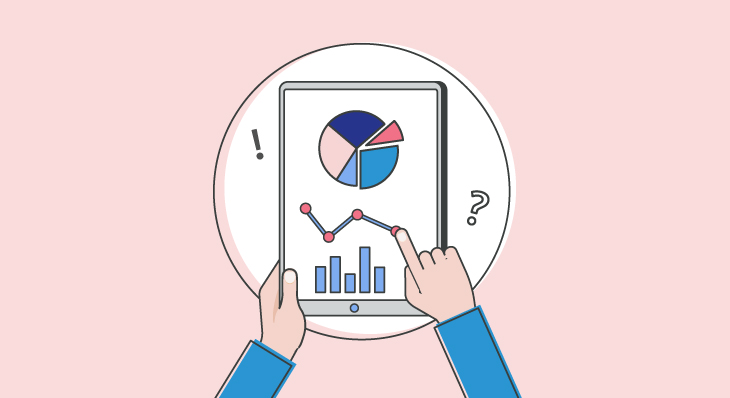
Whether you’re looking to embed real-time analytics within an existing product, or are loo...

Reacting to events as they occur helps businesses to make tactical decisions immediately a...
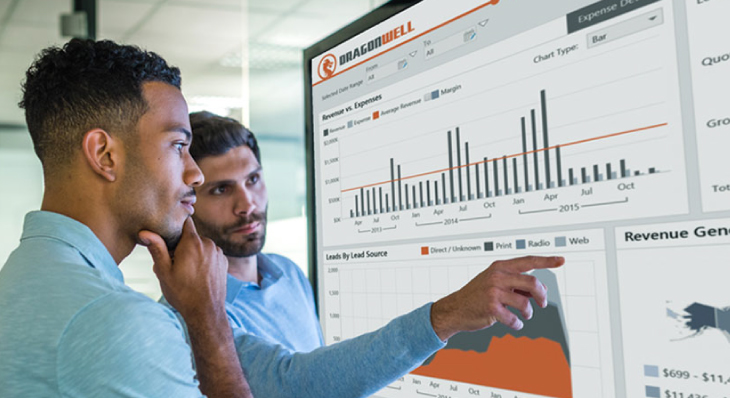
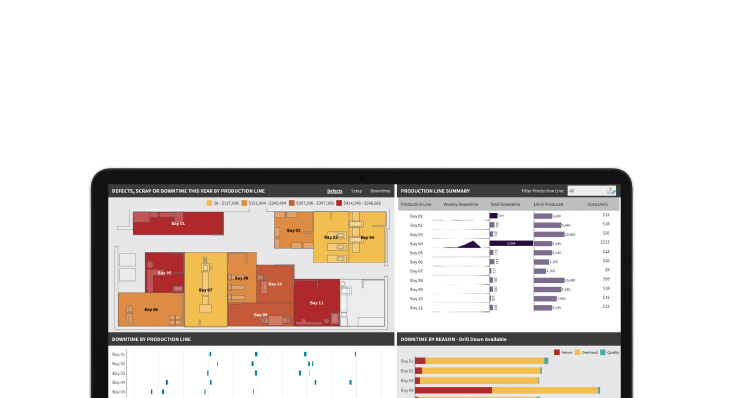
Wall-mounted dashboards are a great way to ensure key business metrics and analytics are m...
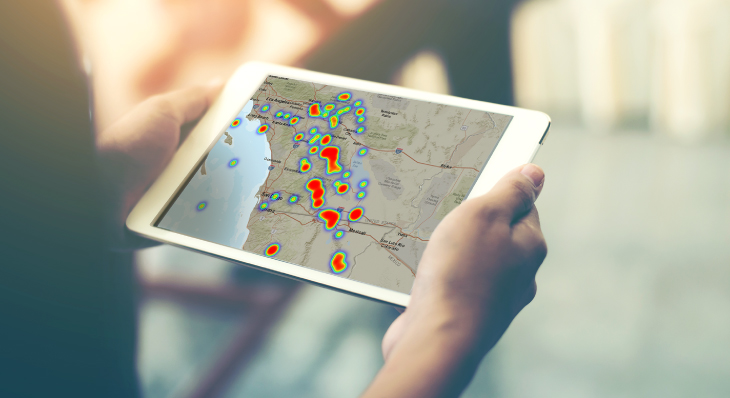
Heat Maps are graphical representations of data that utilize color-coded systems. What man...

Use animated charts to tell stories with your data and make your audience understand how a...

Awesome applications need awesome embedded analytics. Let's take a look at 3 data-savvy co...
Don’t simply show your data, tell a story with it! By combining Custom Diagrams with an an...

This is part two of a two-part series on why companies should consider replacing Excel wit...

3D charts are frowned upon in the data visualization world, especially when it comes to 3D...