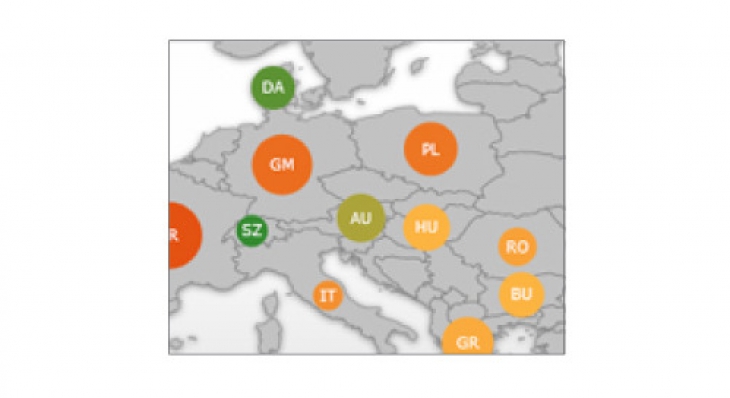
Data Visualization is everywhere. You may not have noticed that it’s made its way out of the offices and into the streets, your homes, and onto your TV screens and computer games; but this has happened.
If you’re a professional athlete, chances are you noticed, since most things in your daily life (training, eating, physio, etc.) are recorded and measured. For the rest of us, however, the change has been more subtle.
Back in the `80s and even the `90s, data visualization was simplistic and limited to specific uses. We had these wonderful devices, these computers, that could render information into a visual format more easily than before, and it was suddenly much easier to look at and understand information, rather than trying to analyze rows upon rows of numbers. But, during those times, data visualization was generally left at the office.
Flash forward to today. Data visualization has become a staple for every department in every type of business. Whether you’re a CEO looking at an executive dashboard, or a construction worker examining hours logged for different projects, data visualization is likely part of your day-to-day job. One common use is stock tickers that use spark lines to display each stock’s recent trading history.

Now, every media outlet includes charts, graphs, and maps, not to mention the increasingly popular infographic. Video games like SimCity, Wii Sports, and Civilization all have them. Data visualization follows you around on your phone, with providers that allow you to graph your data usage. Heck, some of us have data visualizations that aim to optimize our sleep, with applications that measure and display one’s sleeping patterns.

It’s not as if we didn’t have data before, or that we lacked the desire to visualize that information in a meaningful and easy to understand way. What’s changed?
Computers
Computers have allowed us to easily visualize information that normally would have taken hours (and in some cases weeks) to do. Software has become more sophisticated allowing more ‘casual users’ to visualize information themselves. In short, data has become much easier to process.
Mobile Devices
Mobile devices or mini portable computers have allowed us to take information with us on the go. We can access and display the data we want, when we want, where we want, which makes it much easier, and more common, to access information.
Communications
One thing that has seen incredible advancement over the past 30 years is communication. We have gone from faxes, landlines, mail, and pneumatic tubes, to email, text messages, and smaller mobile devices. In the western world, where infrastructure is strong, we have come to expect information almost immediately. When a web page takes more than a couple seconds to load, we find ourselves sighing, or even cursing. We now expect to instantly be in touch with each other, news, and, just generally, information.
We are on the cusp of the data age: a time where information will not only be collected on all aspects of business, but on personal lives as well. Remember the example of the athlete earlier? His or her daily actions are tracked, down to the finest details. And, mobile devices are turning into a sort of personal recording device; measuring our interactions, our likes and dislikes, where we go, and when we are most active. All of this massive and frequent information being recorded and collected has been coined ‘big data’. Big data is one of the “biggest” buzz words around right now, much like Mobile BI was in 2010/11. While things like social media analytics are currently pushing Big Data to new heights, you ain’t seen nothing yet.
As a species, we are inquisitive by nature. We seek to understand our world, our society, and each other. While being able to display data certainly won’t help us understand all of our questions, it will certainly provide us with further insight into it and into ourselves.
