I would define self-service analytics as that side of business intelligence where you enable your end-users to create data visualization dashboards and reports with minimal to no IT support.
Why do you need self-service analytics?
As organizations are becoming more data-savvy, people are getting more result-driven data-literate too. It will become practically impossible to cater to every exploratory analysis request in a timely fashion if there’s a dependency on your IT teams. Therefore, your end-users need to be equipped with tools that allow them to independently explore the vast pool of enterprise data to answer their queries. Self-service analytics enables your end-users or business users, as we call them, to do that without breaking the underlying data.
So, if you are a Data Engineer, you would want to give a structure to your data and make it available to, say, the marketing department, which then explores various measure and dimensions to create reports that help them get the most out of their marketing dollars.
If, however, your business users are not savvy enough to create visualizations from the structured data you provided, you could create a variety of charts for them to choose from based on their use cases. I will walk you through an example of that in a bit.
Case in Point: Self-Service Dashboards for Marketing
Marketers are said to be one of the biggest data consumers in any organization. At any given point in time, there are multiple channels marketing a product or service to several customer segments spread across geographies through a host of campaigns. And every member of the marketing team could be interested in looking at reports that help them make better decisions for their focus areas.
As an active business user whose decisions are significantly data-driven, here’s what our Marketing - Community & Content Lead, Tejas Shah, had to say about self-service analytics - “Ever since I was equipped with a self-service analytics capability, I’ve been an over-joyed data consumer.
To give you a quick perspective, my community analytics module is comprised of eleven dashboards that cover various areas such as overview, retention, referrals, return on investment (ROI), hub health, etc., that have 110 visualizations made using approximately 370 data points. For my current quarter key performance indicators (KPIs), I am particularly interested in only seven visualizations out of this lot.
With the ability to pick charts that answer my specific questions around audience understanding, I spent exactly two hours putting my personal dashboard together that I spend no more than 30 minutes daily to optimize my strategies.”
How does one create a Self-Service Dashboard in Dundas BI?
With the help of SubCanvas View Containers and APIs (mentioned at the end of the article), you have the flexibility to create and fully customize the self-service analytics experience for your business users. Let me show you an example of what it would look like for your users.
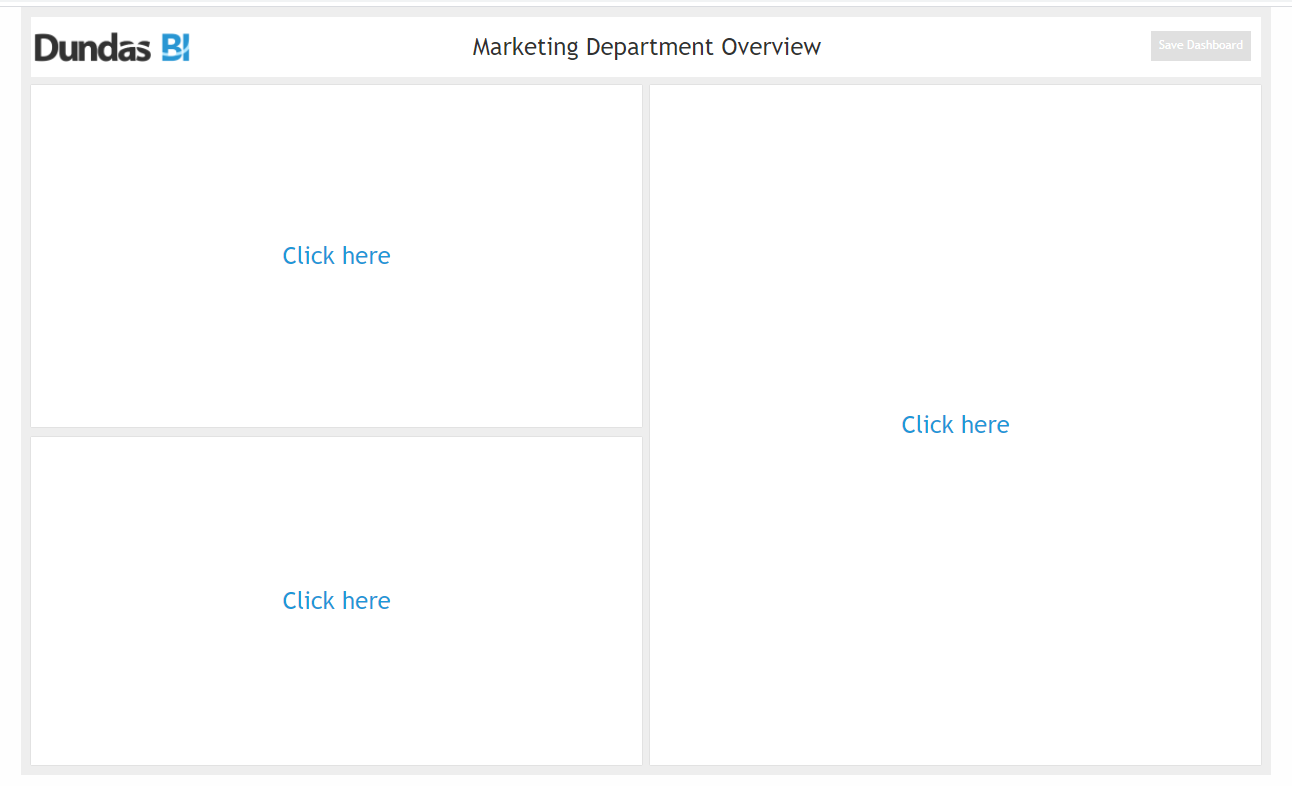
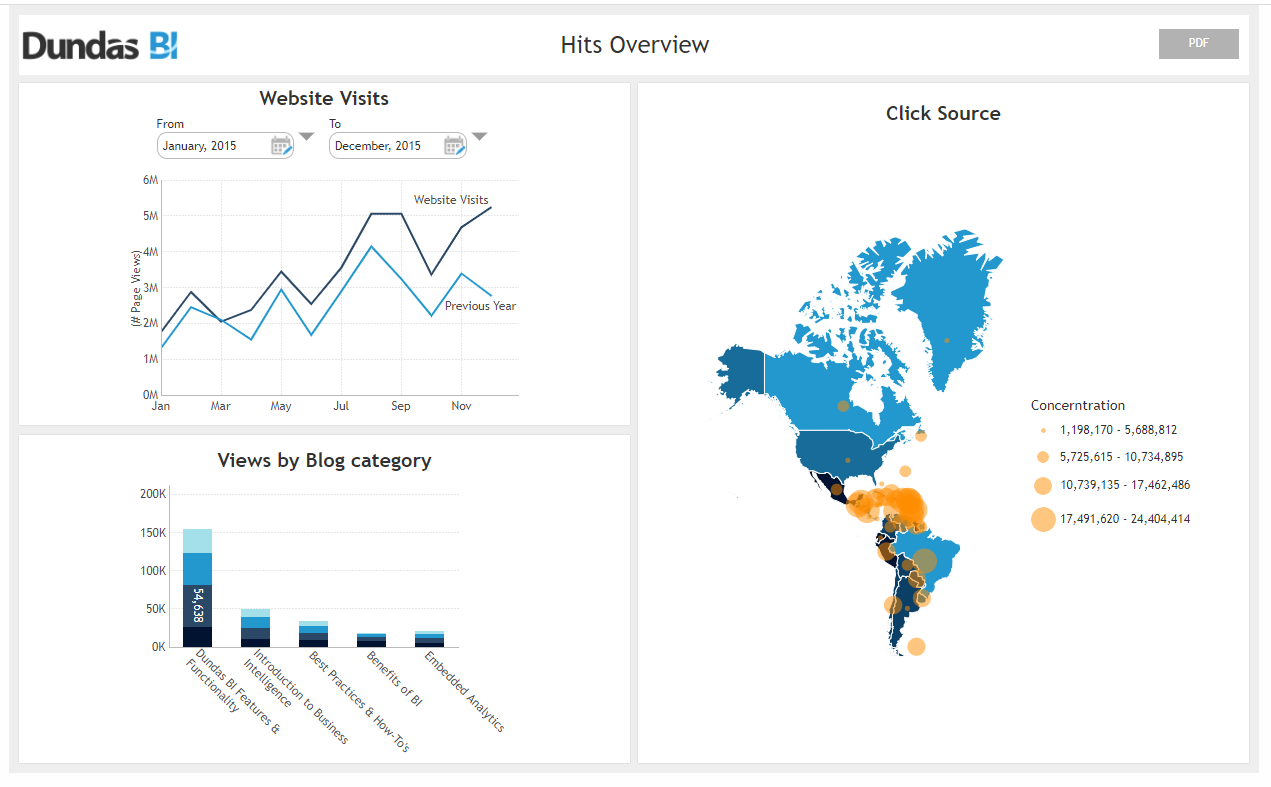
Step 1 – The process starts with your users looking at a templatized screen that allows them to pick three charts from the pool. Remember, this template is only for demonstration purpose. You have the freedom to completely customize it as per your requirements – from a number of visualizations it can fit to the look & feel to match your organization's branding.
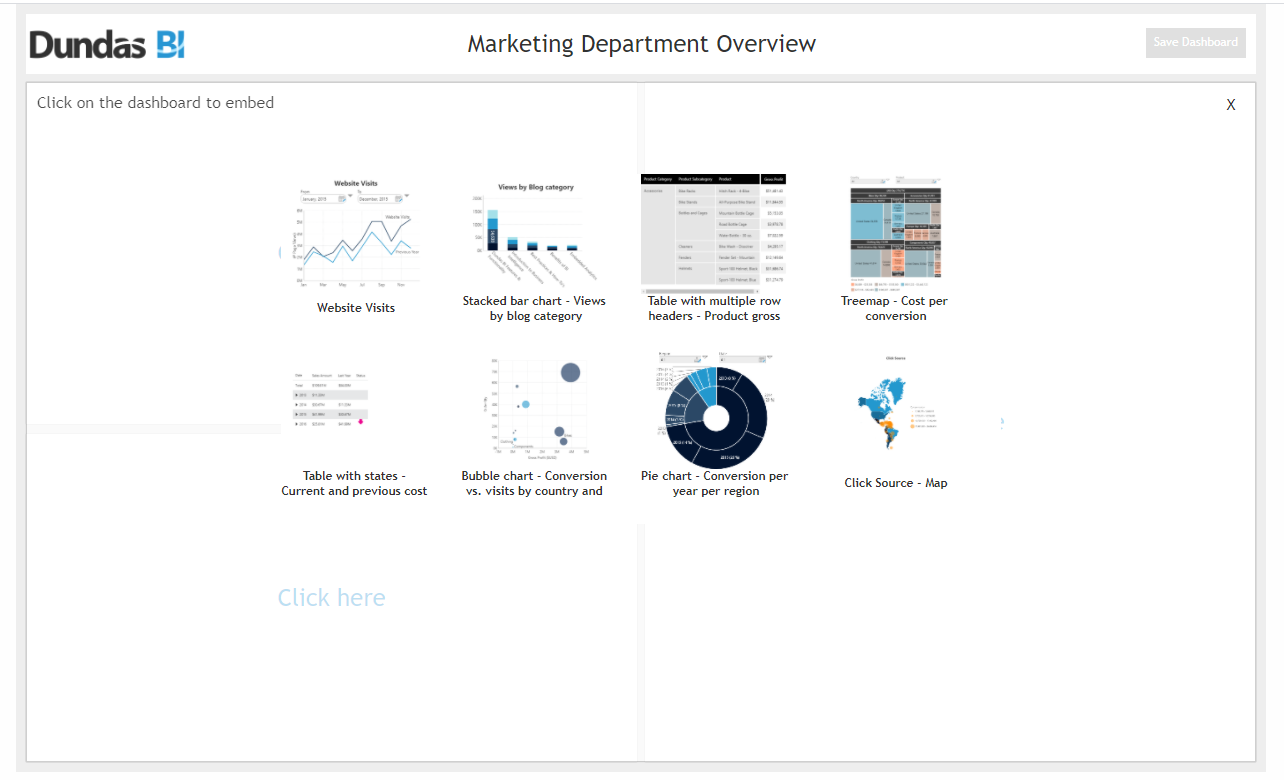
Step 2 - The users click on the first section to view the list of visualization/charts they have access to, to add to this dashboard.
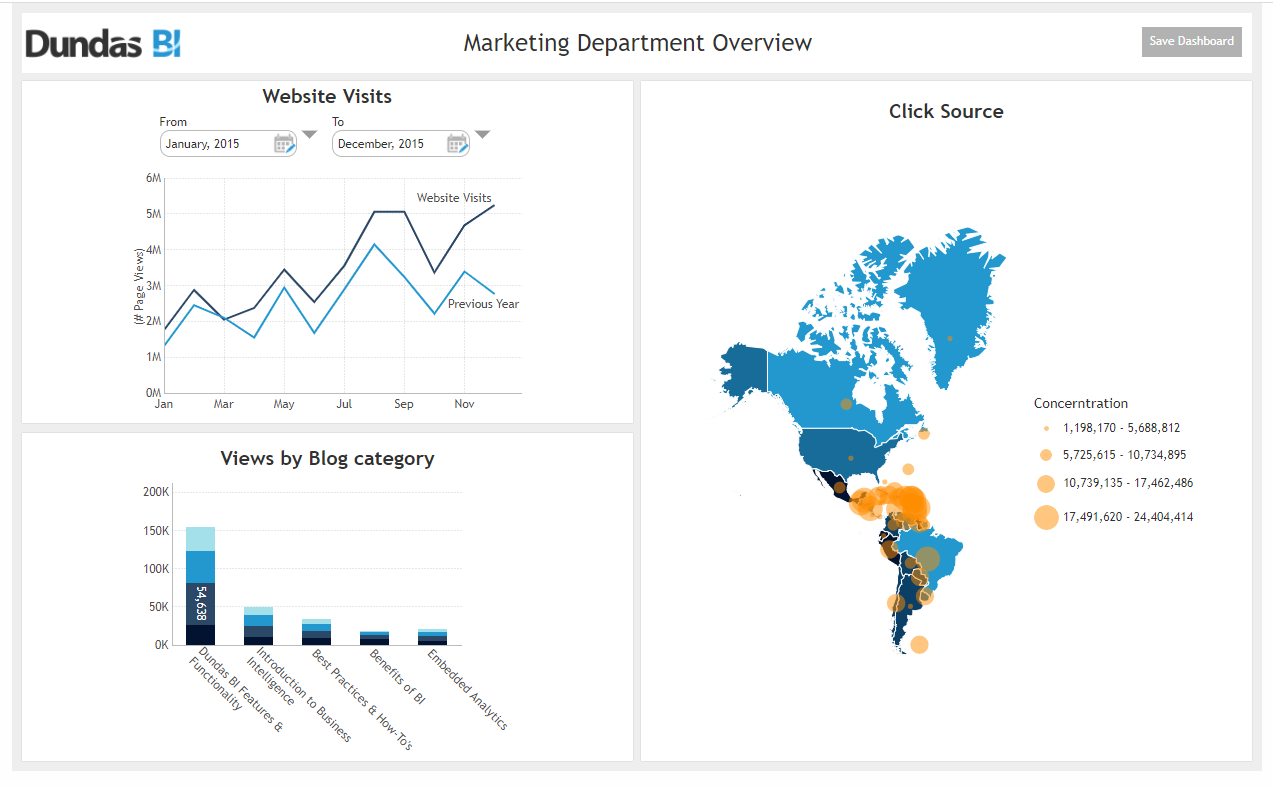
Step 3 – They repeat the process until they have picked their top three charts to complete the dashboard.
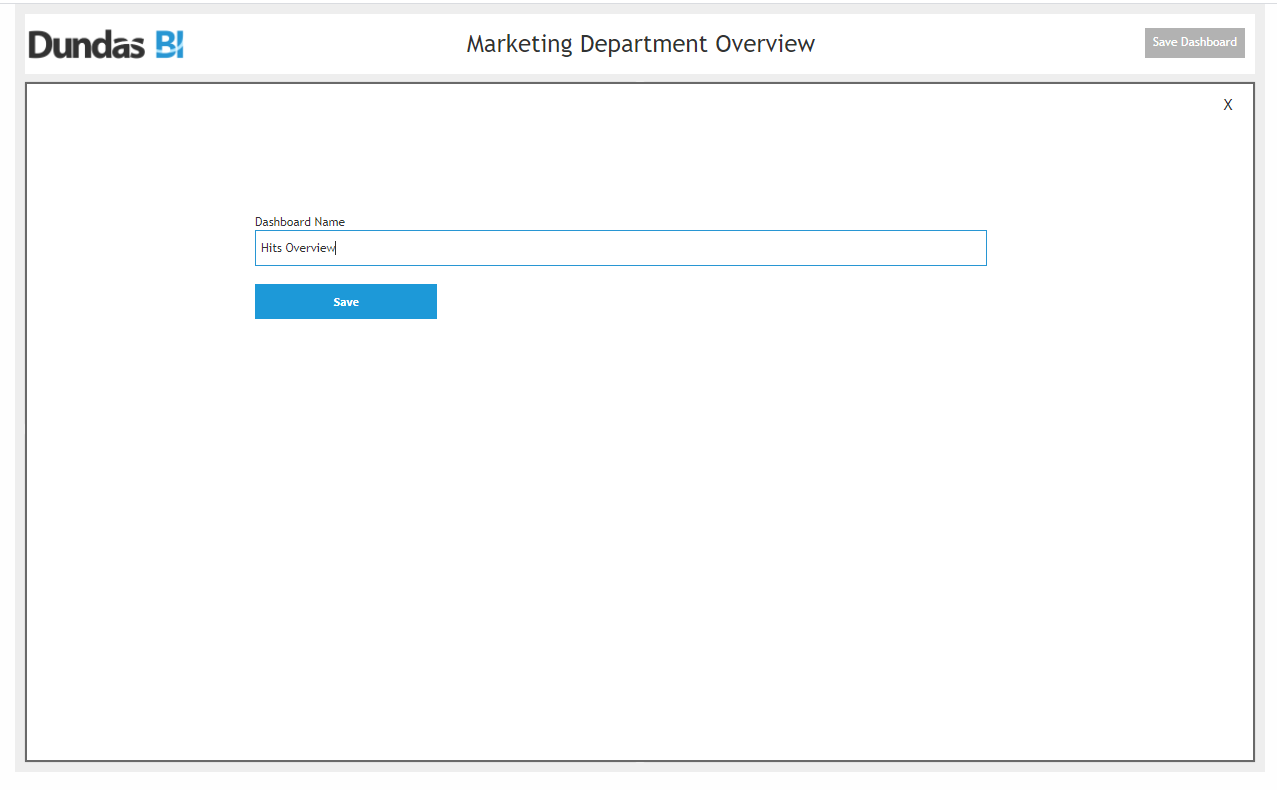
Step 4 - Once they are satisfied with what they see, they can click on Save Dashboard on the top right to save this view as their own custom stand-alone dashboard. This will open a dialog box where they can give their dashboard a name before saving it. This name will reflect as the new dashboard’s title.
Step 5 - Once saved, the self-serve dashboard will ask them if they would like to navigate to their newly created personal dashboard.
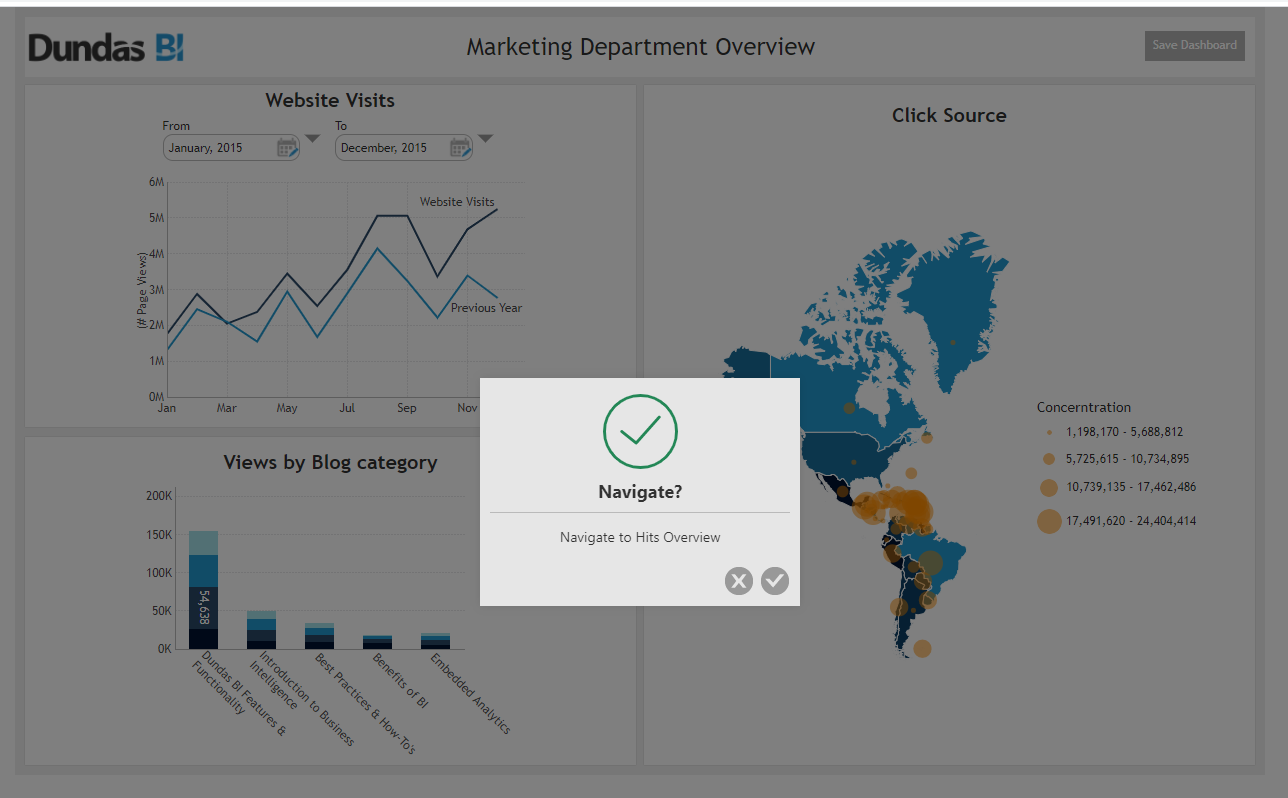
By clicking on “Yes” they will be navigated to their dashboard which they can now access at any given point in time to track the progress of their marketing efforts.
On a side note, if you’re transitioning out of Excel or are new to data analytics platforms yet still interested in incorporating this capability in your organization, our Professional Services team can help you get off the ground smoothly and efficiently.
You can learn more about our services here. Alternatively, you can simply drop us a text in the chatbot on our website and we can take it from there.
APIs used to create the Self-Service Marketing Analytics Dashboard
SubCanvasViewContainer.setTarget Method – Sets the target of the sub-canvas view container.
AccountService.getUserData Method - Gets the user data for the specified account.
CanvasService.getLayerByName Method - Get layer.
DashboardService.createLocalUserCopy Method - Creates a local user copy of a view, along with any metric sets that are not subentries.
AccountService.writeUserData Method - Writes the user data into the account.
FileSystemService.setTags Method - Sets the tags on the given file or folder.
ViewService.navigateToPage Method - Navigates to the requested page with additional optional options.
Data Cube/File/Query – This API is used to get the list of all the dashboards to show on the dashboard.
Recommended watchlist:
3 Easy Analytical Capabilities Your Users Are Missing Out On
Build It, Dream It: Self-Service Dashboard
Recommended reading:
6 Steps to Achieve Self-Service Success
A Reference Architecture for Self-Service Analytics
About the Author

Dany Nehme is the Manager of Professional Services at Dundas Data Visualization. As the leader of the Professional Services team, Dany works with his BI Consultants to ensure they provide guidance to both veteran and new Dundas BI clients, enabling them to implement Dashboards and custom solutions in a best practices manner.
Follow on Linkedin