Most BI requirements are similar across enterprises in regards to connecting to the data, preparing it, analyzing and visualizing it. Dundas BI offers the ability to satisfy these requirements out-of-the-box. In most cases, the built-in user interface (UI) is sufficient enough to cater to these requirements, however, there may be specific instances where users could benefit from their own tailored UI to meet their own specific needs.
Whether you need a specific data preparation task or you need a chart to behave in a specific manner or connect to a specific data provider, you can use Dundas BI’s open APIs to customize the solution to meet your specific requirements. This list of examples can go on and on – this is why Dundas BI is ranked as the most flexible BI platform.
One great aspect of Dundas BI’s user interface flexibility is its full exposure to the underlying APIs that enable customization of any aspect of the application. If you feel a new functionality could really support the way you or your users operate, use the API and add a custom UI to cater to that new functionality. Let’s discuss one such use case here.
Files Check-in/Check-out Administration
The check-in/check-out functionality allows the users to collaborate and share content with others. If a specific object such as a dashboard or a data cube needs modification, check-out that object, make your changes, and check-in when the changes are ready to be shared with others.
For an easier administration experience across all users and all projects, one of our customer’s administrators mentioned that they want to be able to monitor and quickly identify which files are checked-out to who, and to quickly check those in from a single UI. That administrator mentioned that while the built-in File Explorer in the Admin panel does provide information on what’s been checked-out, it’s difficult for them to get the information on who the files are checked-out to and the time of the check-out across all projects. This is where the APIs come in handy, by allowing us to design a custom UI to cater to this very need.
By executing a REST API call using the built-in Python data generator, we can directly query Dundas BI to fetch all the checked-out files in the system along with what project they belong to, who it’s been checked-out to, and at what time. We can then build a custom user interface using the built in Dundas BI designers as if we were to build any other dashboard. In this case, we built a dashboard that allows an administrator to monitor all this information in one place, and check-in those files if required.
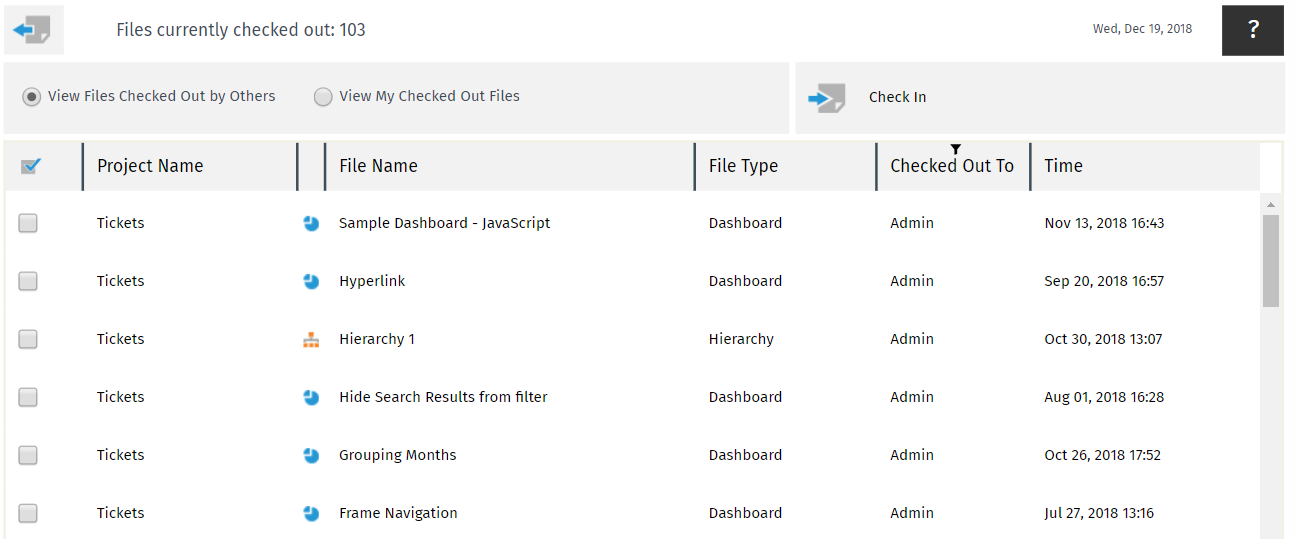
The UI above displays all the checked-out files along with what project they belong to, who it’s been checked-out to, and the time of the check-out along with the total number of files currently checked-out in the system. The check-in button uses the JavaScript API to check-in all the selected files from the table.
You’re also able to switch between viewing files that’ve been checked-out by others or your own checked-out files. Viewing others checked-out files allows you to transfer them and then check-in, if needed.
Note that files checked-out under My Project are NOT included here, as those are personal files that usually don’t impact others if they are checked-in or not.
In addition, you can always roll back to a previous version if needed, by going through the revision history of the file using the Dundas BI built-in version control.
You may have also noticed that this sample combines the usage of both the REST and JavaScript API. In this example, the primary reason for using the REST API and not just the JavaScript API – like in this sample – is that we wanted to get the data back to us from a data cube, so that we can use the native Dundas BI visualizations and interactivity, such as the ability to sort, filter and view data in a nicely formatted table. If we were to do it all using the JavaScript API, we would have to build tables using HTML or something similar, which would limit our user experience.
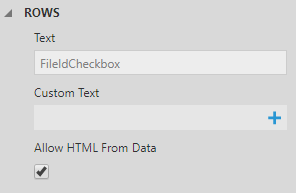
One more interesting functionality you’ll notice, is the ability to check-in multiple files in bulk using checkboxes on the table visualization. A selectable checkbox is not a column type available on the table, however, an additional column was added to the query result that returned an HTML checkbox column type. On the table itself, the column displays the checkboxes by selecting the Allow HTML From Data option.
Getting This Sample
You can download the above sample here.
Make sure Python is installed on the Dundas BI server and the following packages are installed in Python:
- Numpy
- Pandas
- Requests
- Json
Import the sample into your Dundas BI instance.
Add a service account and make them a part of the System Administrator group within Dundas BI.
In the Checked Out Files Administration project, open the Python Data Generation transform in the Checked Out Items data cube and replace the host to point to your instance:
host =http://your_Instance/api/
Replace the userName and userPassword with the corresponding values for the service account created above:
serviceAccount = {"name": " userName ", "password":" userPassword "}
The sample is designed for use by the system administrators. For any user that would be using the dashboard to view the checked-out files, add them as part of the System Administrators group.
Open the Checked Out Files dashboard. You should be able to see all the files that have been checked-out.