The ultimate goal for Business Intelligence solutions is to reveal data insights so better actions can be taken. In most cases, the process of understanding insights and taking actions involves more than one person, which means that collaboration in some form needs to take place to best put the data to use.
In many organizations, collaboration is done through traditional methods such as sending emails, which either occurs manually or based on pre-defined schedules or threshold driven alerts. Other companies may use internal chat tools or team collaboration tools with real-time messaging capabilities. While these methods are great for different use cases, they are limited when it comes to ensuring the collaboration is done in the context of the data at hand. Emails and chats tools are introducing yet another system to share and store insights around the data that lives in your BI system. This makes it harder for people to understand where/why the original discussions began, and even harder to sustain a shared dialogue on the insights found within the BI system, particularly when the data is revisited again in the future. With these methods, insights simply get lost.
Rethinking Collaboration in BI Tools
To get away from side discussions occurring in 3rd party tools, the conversations need to move directly into the BI tool – right next to the data. In practical terms, users should have the ability to add their notes or annotations to the data, and have group discussions by placing their comments, thoughts, questions and answers within their dashboards and reports. Anyone that is looking at the data for the first time or after 6 months (for example), and is curious about a data point, should be able to go through the discussion thread and get answers immediately or ask new questions and participate in the discussion.
What's Unique about Dundas BI's Collaboration with Notes?
While some modern BI tools have adopted the concept of having collaboration done within the tool, with Dundas BI, we took it one step further and were even awarded a patent for our approach. Instead of having comments displayed in a side panel within the BI tool, the Dundas BI collaboration experience is unique in that it takes place directly on top of your visualization. There is no need to look at your dashboard and then go through comments on the side and have your eyes wander to try and relate the two. In Dundas BI, the comments are displayed right on top of the exact data point (for example, at the ‘spike point’ in your chart, or on a ‘poorly performing location’ within your map visualization.
The chart below shows a similar discussion taking place, and anyone looking at this thread can easily understand that this specific discussion is about the dip in Sales for Q4, comparing to the previous year:
There are a few others factors that make Dundas BI’s notes more valuable and better for collaboration:
- Visualizing Notes: The discussion is marked with the first few words of the note as opposed to using a speech bubble (when space allows for it). This is done deliberately in order to help users begin to understand the discussion context by just looking at the chart without even interacting with it. This also helps in raising curiosity levels, and prompts the user to open the comment thread to engage further in the discussion by providing additional feedback. The chart below shows this capability where just by looking at the chart you can see that the discussion is about a year over year gap in sales during that quarter:
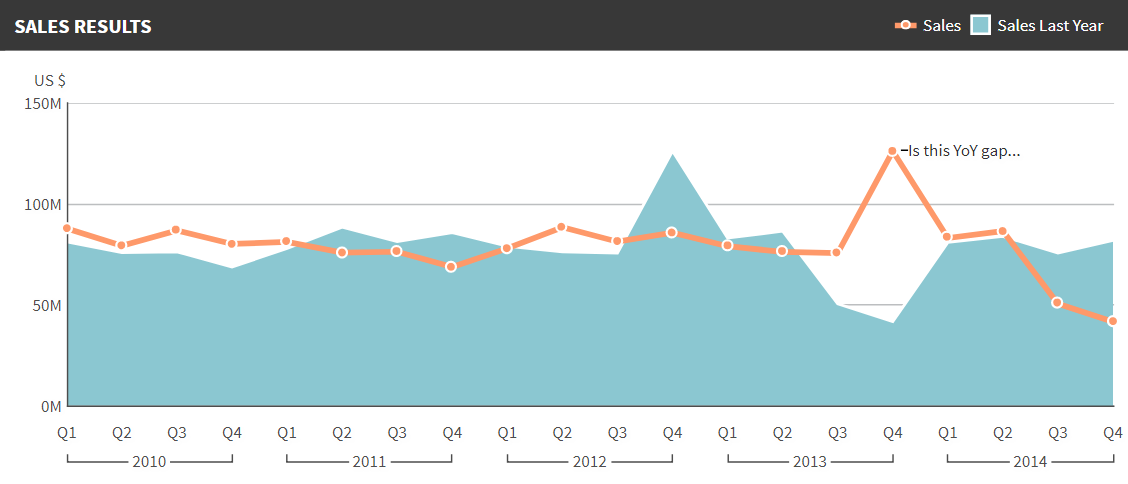
Figure 1: Portion of Notes Visible in Dundas BI
- Reusing Notes: The notes applied to a data point on a particular visual will not only appear on that visual but also on any other visual that is reflecting the exact same data point. This is great for any user that is performing a new data exploration, as the insights already shared by others will show up in the new visualization, ensuring efficiency and alignment across the business. Compare this to side discussions and emails where the insight has to be shared over and over again – chances are that those insights are already lost.
- Notes Security: One of the concerns raised when looking at the notes is around security and who gets to view these comments. Controlling the visibility of the notes becomes important, especially when dealing with sensitive data. In Dundas BI, you can secure the discussions by adding or removing users or groups when you are adding the notes. You can even make the note private for just yourself to remind you of different items that are only relevant to you. With this kind of security control, users without the appropriate permissions will only see the chart and not the discussion associated with the data point on the chart.
- Notes Notifications: Using note driven notifications, business owners of the different KPIs on which the notes are added, can be automatically notified about any new questions/comments added to the metrics they are responsible for, or have subscribed to track. This is a great way to make sure that the users are always on top of any communication done via notes and discussion threads without waiting for someone to open the dashboard to read the notes. For example, the VP of Sales can ask a question to the Sales Manager regarding the sales numbers and an automatic email alert will notify the Sales Manager about the need to respond. Those alerts can be sent via different channels as well, such as slack, SMS and others.
- Notes for Storytelling: Sharing a data story is another area where notes can play an important role in helping users to understand their findings. For example, Dundas BI slideshows can incorporate charts with notes so as the users browse through the slides, they would read the note on a chart and if they wanted to learn more, they can navigate to the chart directly from the slideshow in order to read the full note or the discussion thread. For more information on how slideshows are used for data storytelling, check out this webinar on collaborative BI
Notes 2.0
So far, we’ve discussed the concept of adding notes on data points and how to use them to communicate with other users. But what if the data point value itself was incorrect or you wanted to change it to implement a what-if scenario on the data? This is where data annotation (i.e. data correction) comes in and is considered the next generation of notes. Using this feature, users can go beyond just adding a comment on a data point, but can actually change its value to correct it or to perform their own analysis by changing the data.
A use case for this might occur if the data was entered incorrectly in the system and the business user wants to see the visual with the right data, or if the system has not been updated yet with the latest data, which the user wants on the visual at that time. For example, you may be the Sales Manager and are looking at the number of units sold for different product categories only to realize that one of the categories is showing a very low number incorrectly. You know that the issue is due to an error in the system that failed to record a major consignment. You can correct this right away by right-clicking on the data point and changing its value to the right one, along with placing a comment on why the change was made.
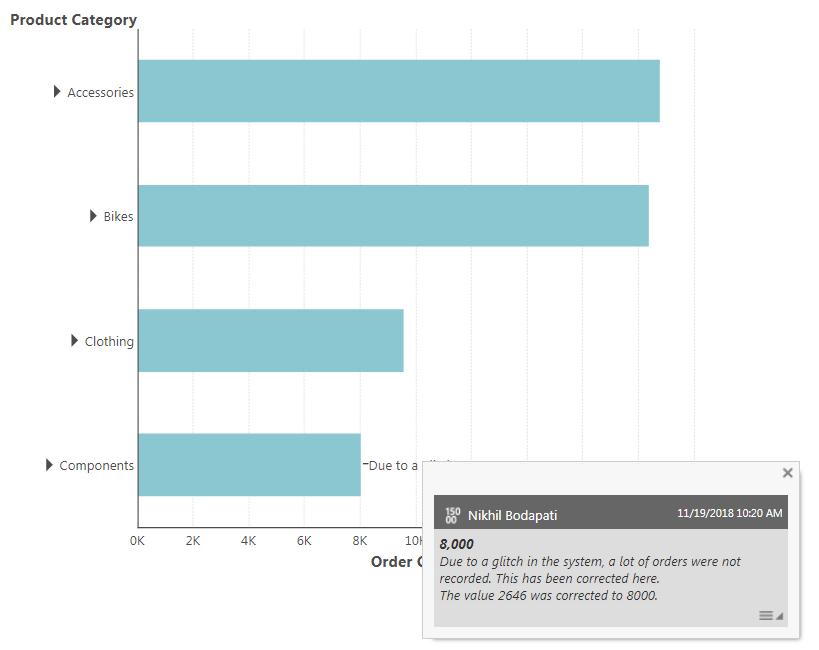
Figure 2: Data Annotation
As you can see, when you make the change, it adds an annotation on the data point to let the users know exactly what changes were made and why. It is important to mention that this type of annotation can never be hidden as it is important to notify others about this data change and of course, with great power comes great responsibility, so by default the permission to correct a value isn’t available to all users unless granted by the administrator explicitly.
As mentioned here are other use cases for data corrections, such as for conducting what-if-analysis. To learn more about those, check out this webinar on actionable analytics.
Next Steps
Try out these collaboration methods yourself! Start using them in your favorite Dundas BI dashboards and encourage others to join the discussion.
Have any comments for us? We’d love to start new discussions with you! Please leave comments below or in Dundas BI’s user forums.
New to Dundas BI? Want to see the notes in action on your data? Talk to us or try it for yourself.