
Writing scripts using browser developer tools
1. Overview
When writing script in Dundas BI dashboards, reports, and other views, you may find it helpful to use your web browser's developer tools when testing and debugging. This article shows you how to use Google Chrome's Developer Tools in conjunction with the script editor.
Dundas BI provides a built-in script editor that pops up with a list of each object's properties and their descriptions as you type, with direct links available to the applicable API documentation. The JavaScript API reference lists and describes all supported API properties and methods, and allows you to easily navigate between different types of objects. The browser's developer tools complements the other tools by allowing you to step through your script while it's running live, and inspect the values of properties and variables.
2. Debug using Chrome Developer Tools
To debug script using Chrome's Developer Tools, simply insert the following line on its own at the point in your script where you want to start debugging:
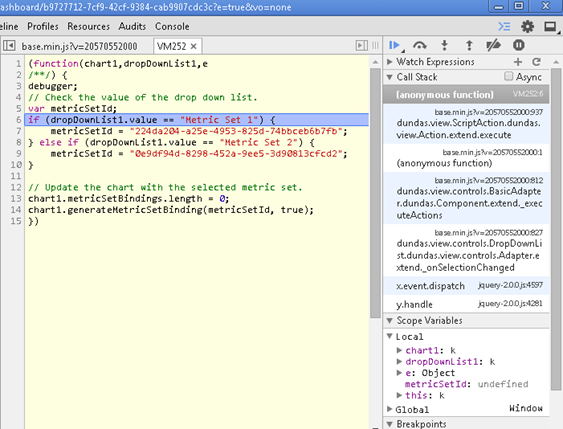
debugger;
For example, insert it at the beginning as the first line. This is a statement that various browsers recognize when their developer tools window is open. When the statement is reached during script execution, the browser's developer tools window becomes the active window and it automatically pauses at this line, allowing you to debug the rest of the script.
Next, click Build.
In the Dundas BI toolbar, choose Sandbox View in order to test the script in a separate tab, without saving the changes it makes as part of the dashboard.
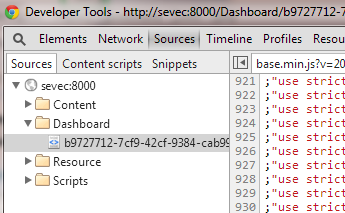
Next, launch Chrome Developer Tools from the Chrome menu in the top-right corner, or press CTRL+SHIFT+I. This opens the developer tools in a separate window.
Now perform the action that will trigger your script. When script execution reaches the debugger statement, the browser's developer tools will become the active window and you can begin debugging.
For example, you can:
- Hover over a variable or property with the mouse to see its current value
- Write expressions or statements into the Console to evaluate it and/or see its results
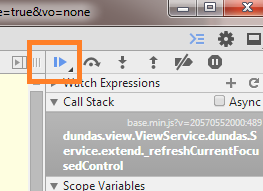
- Step over each line one-at-a-time to see where values are changing, by choosing this option in the toolbar in the top-right, or pressing F10
- Add a Watch Expression that will update automatically as you step through lines of script
Once you've finished debugging your script, go to the toolbar in the top-right corner of the developer tools and click Resume script execution, or press F8.
3. Notes
- While you can name controls in Dundas BI in any way you would like, JavaScript does not allow leading digits in function parameter names. To avoid errors in certain scripts, Dundas BI prefixes an underscore (_) when the adapter name starts with a number. This means, if the parameter name is 1Label, you will have to use _1Label to target it in script.